university of waterloo | master of architecture thesis project
massive-scale agency

project Summary
GOAL: Create a tool that encourages people to make informed decisions that lower their carbon emissions
PROJECT DURATION: 2 years
ROLES: UI/UX design, user research, user testing, prototyping, interviews, surveys, data visualization
TOOLS: Framer (Prototyping), Tableau (Data Visualization), ArcGIS (Mapping), Mapbox (Prototyping), Illustrator, Photoshop, Excel


01 | CONTEXT & RESEARCH
The thesis work completed for my Master of Architecture explored methods of presenting information relating to our carbon emissions. The research concentrated on giving individuals an informed choice about everyday actions, consumption of goods, and their required embodied energies.
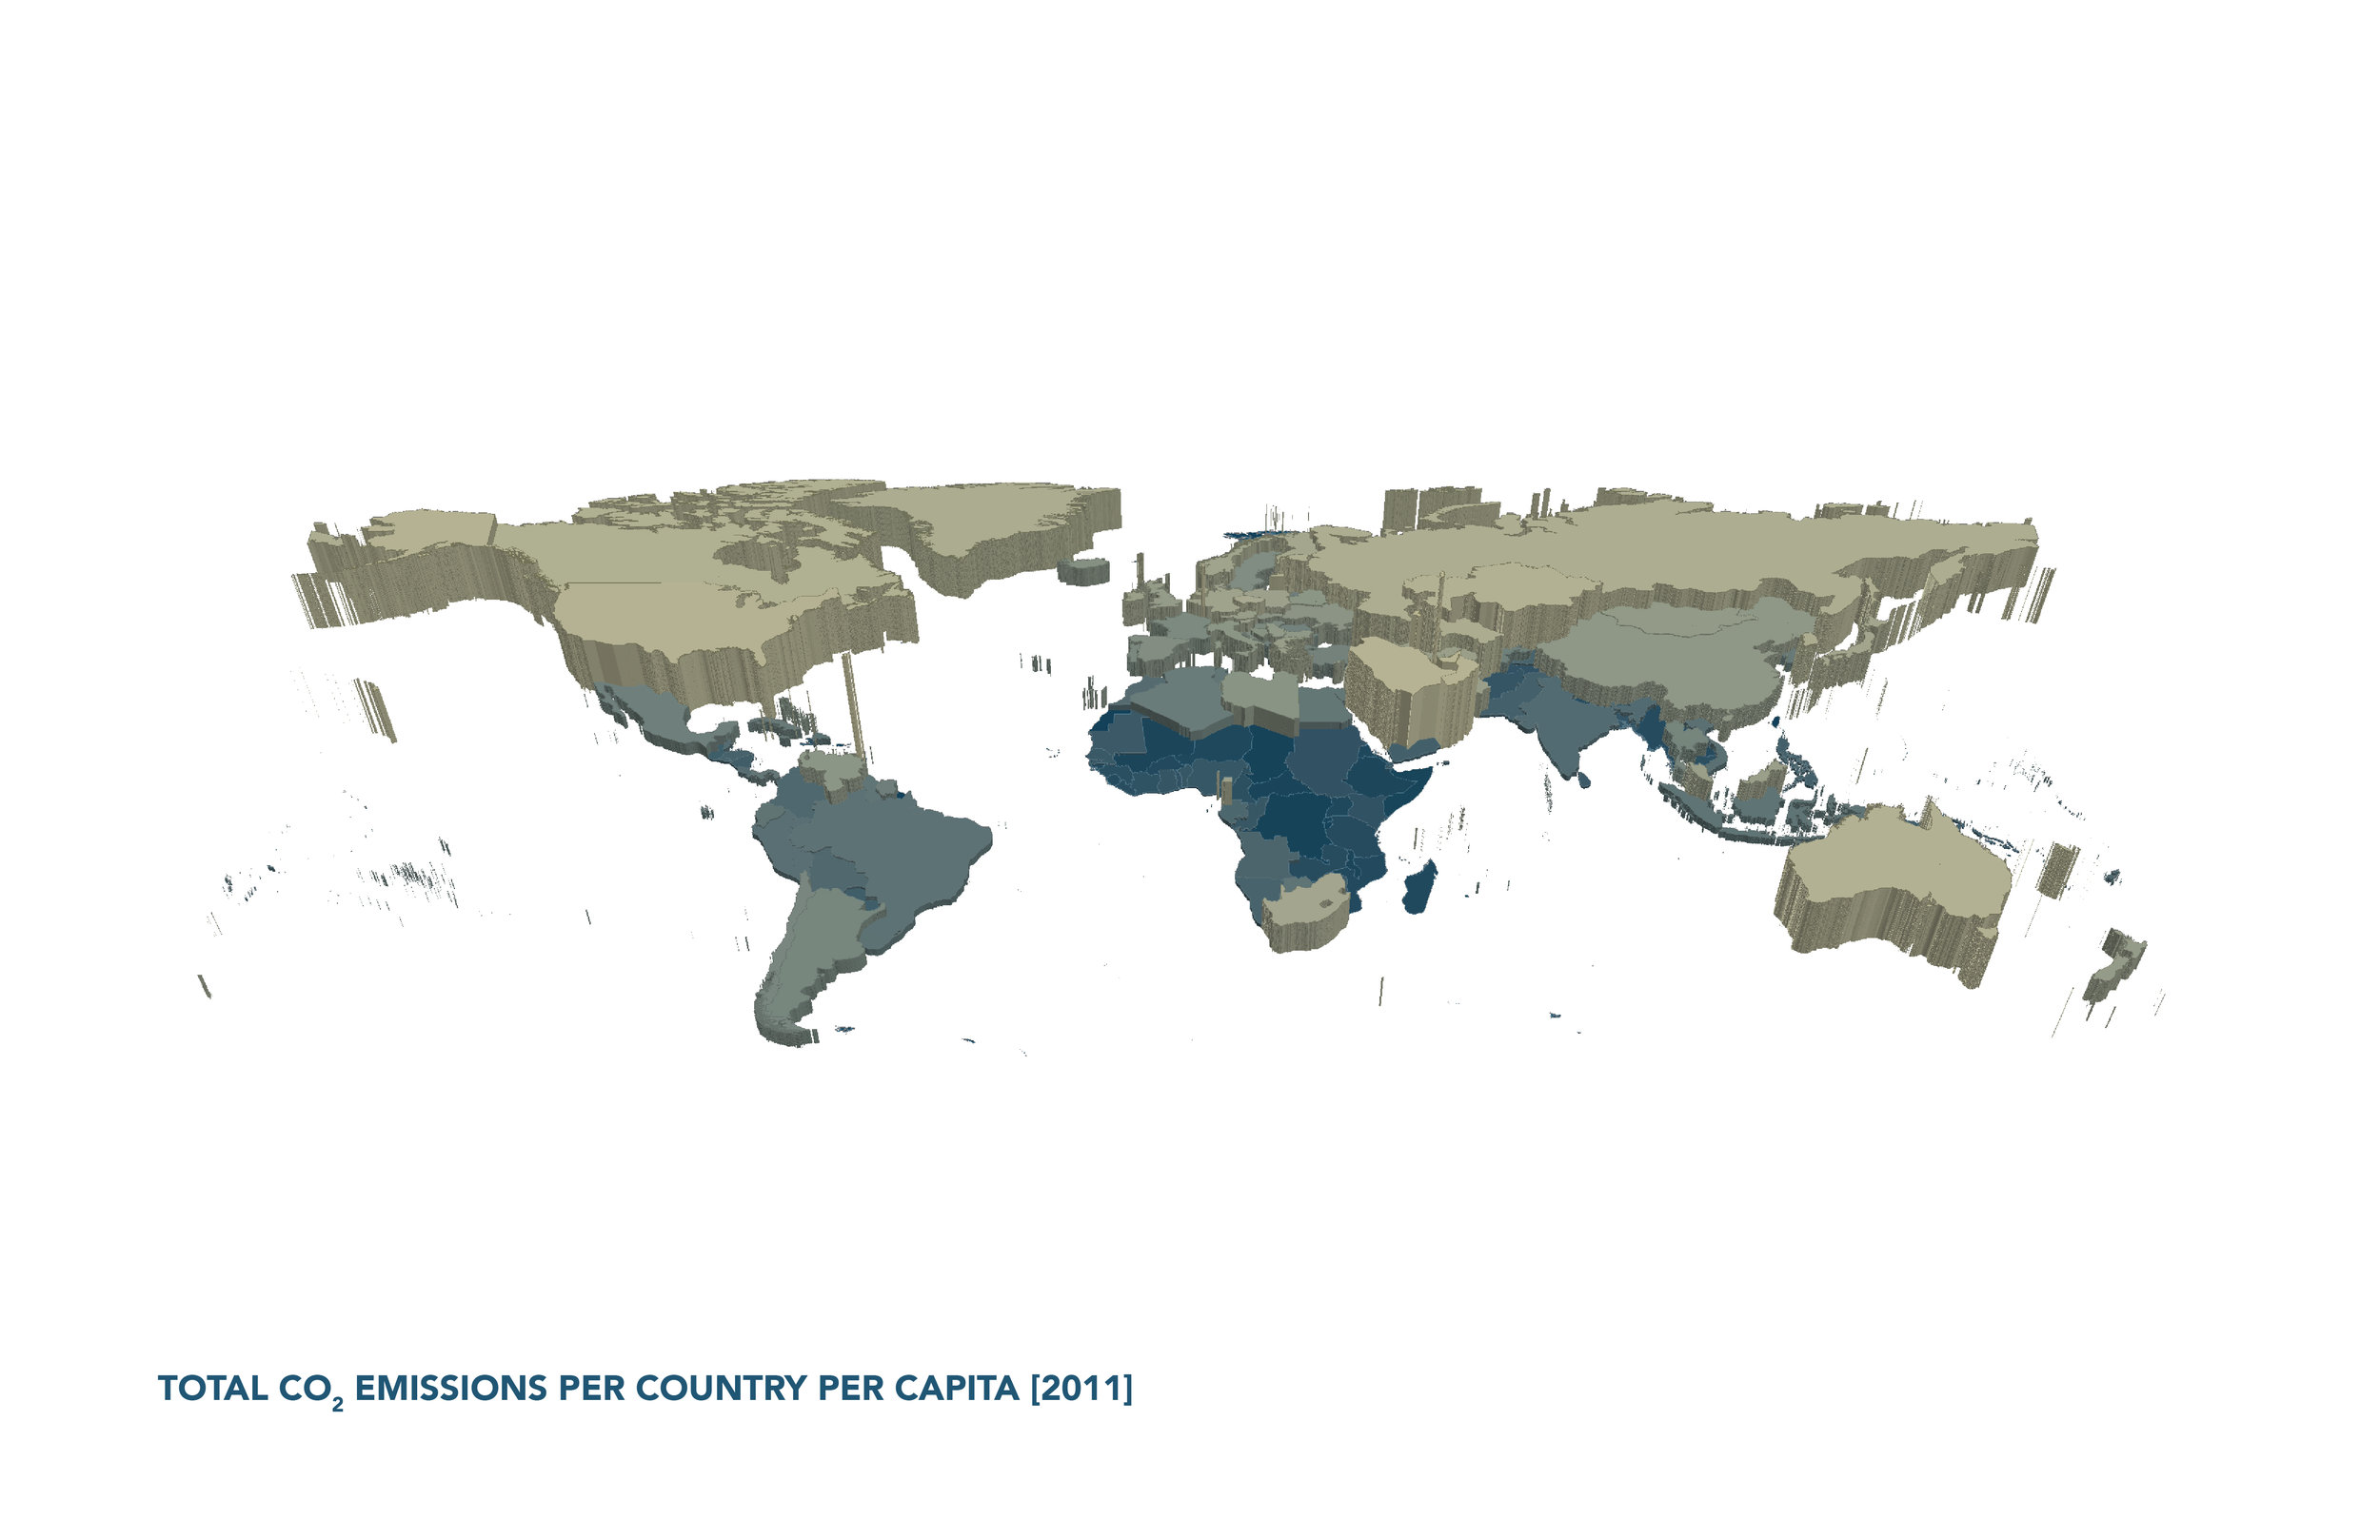
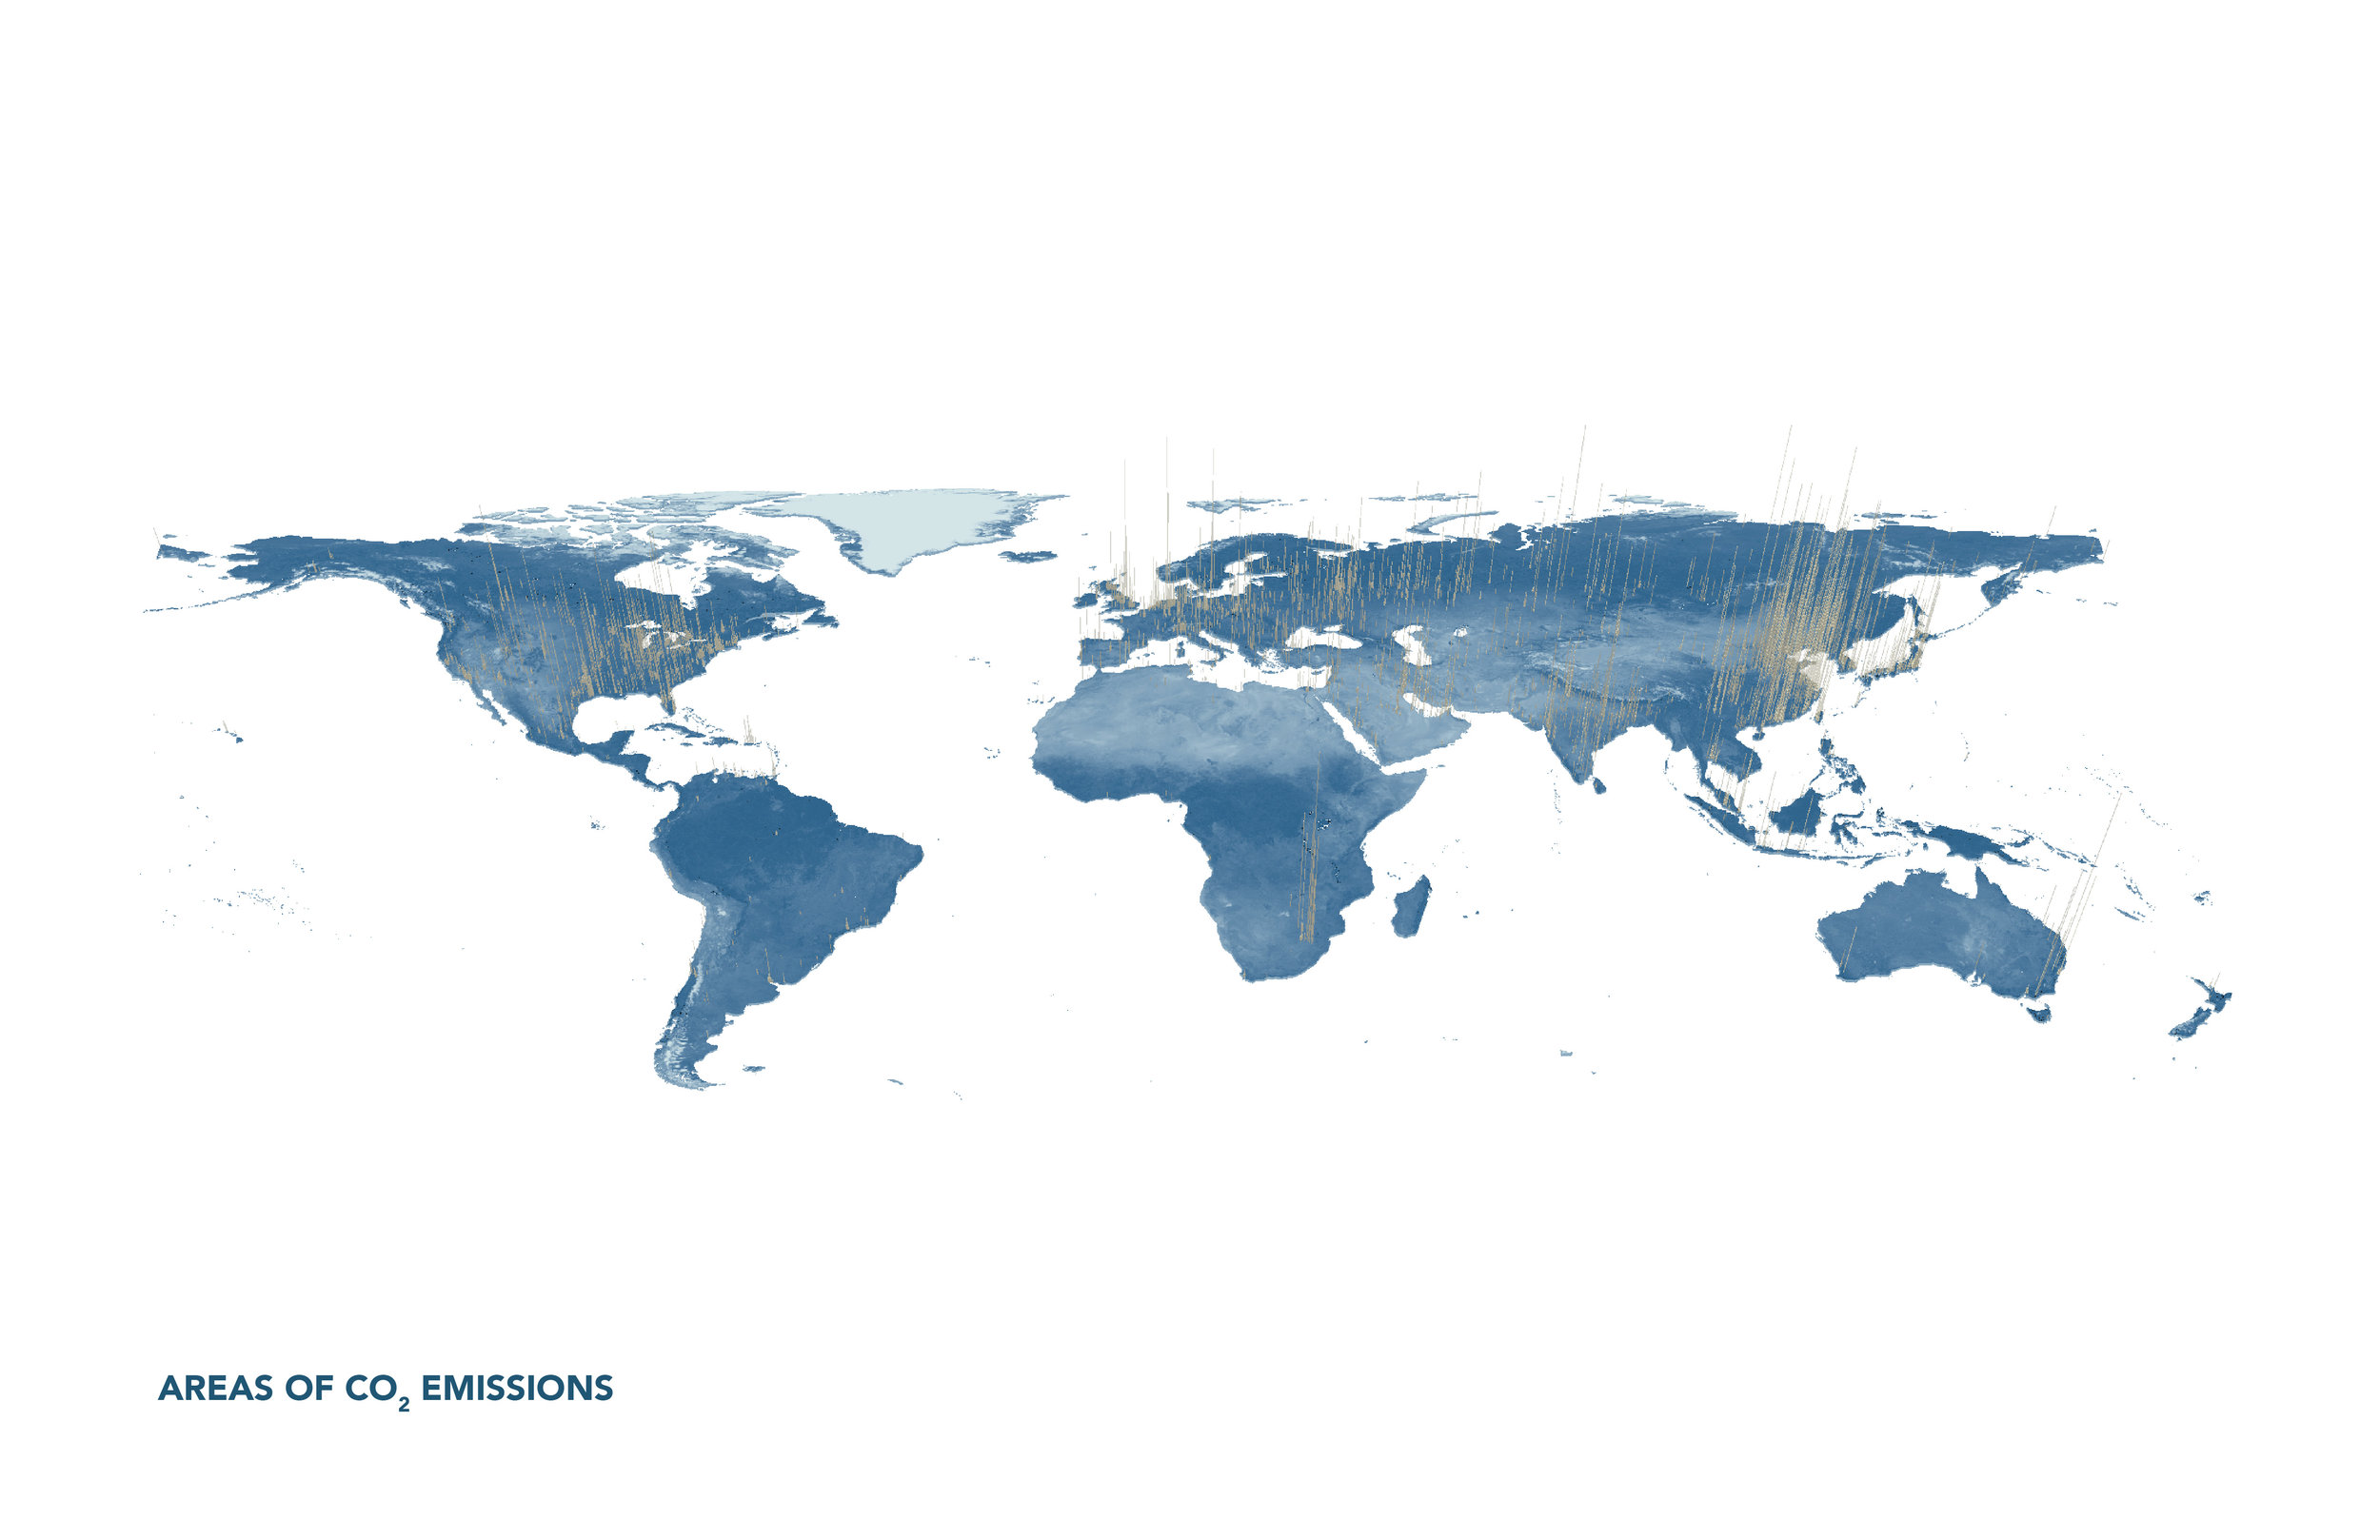
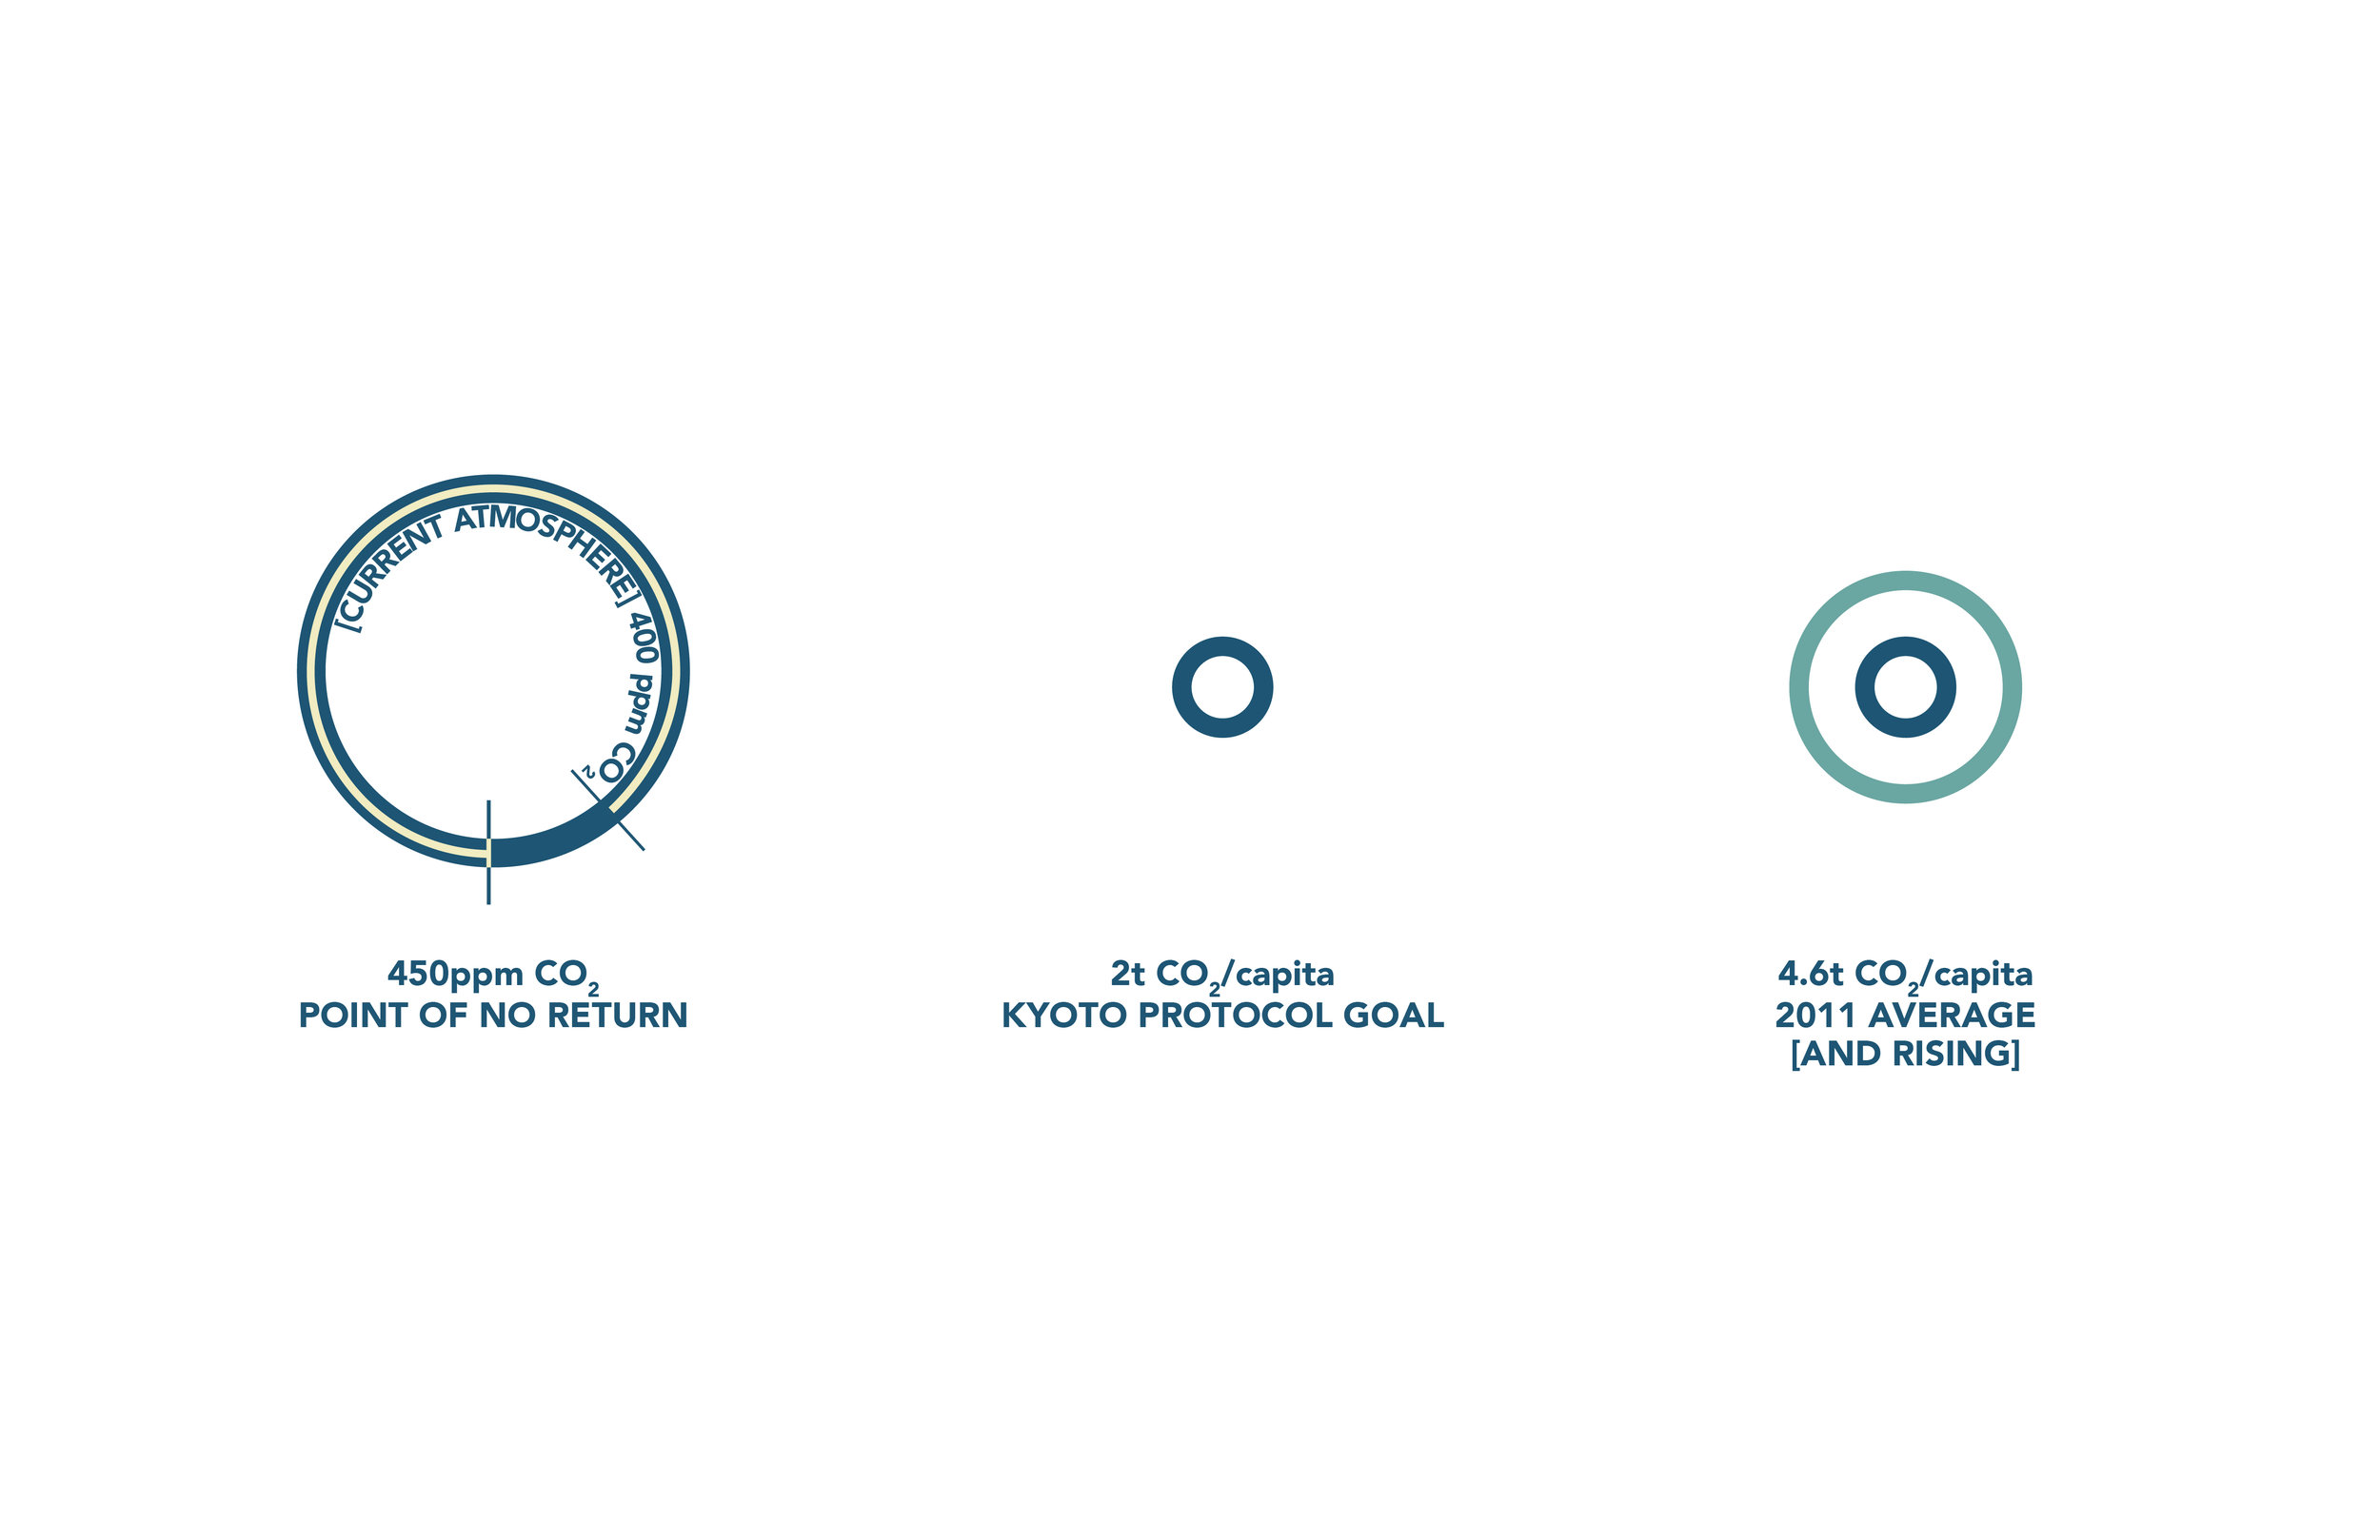
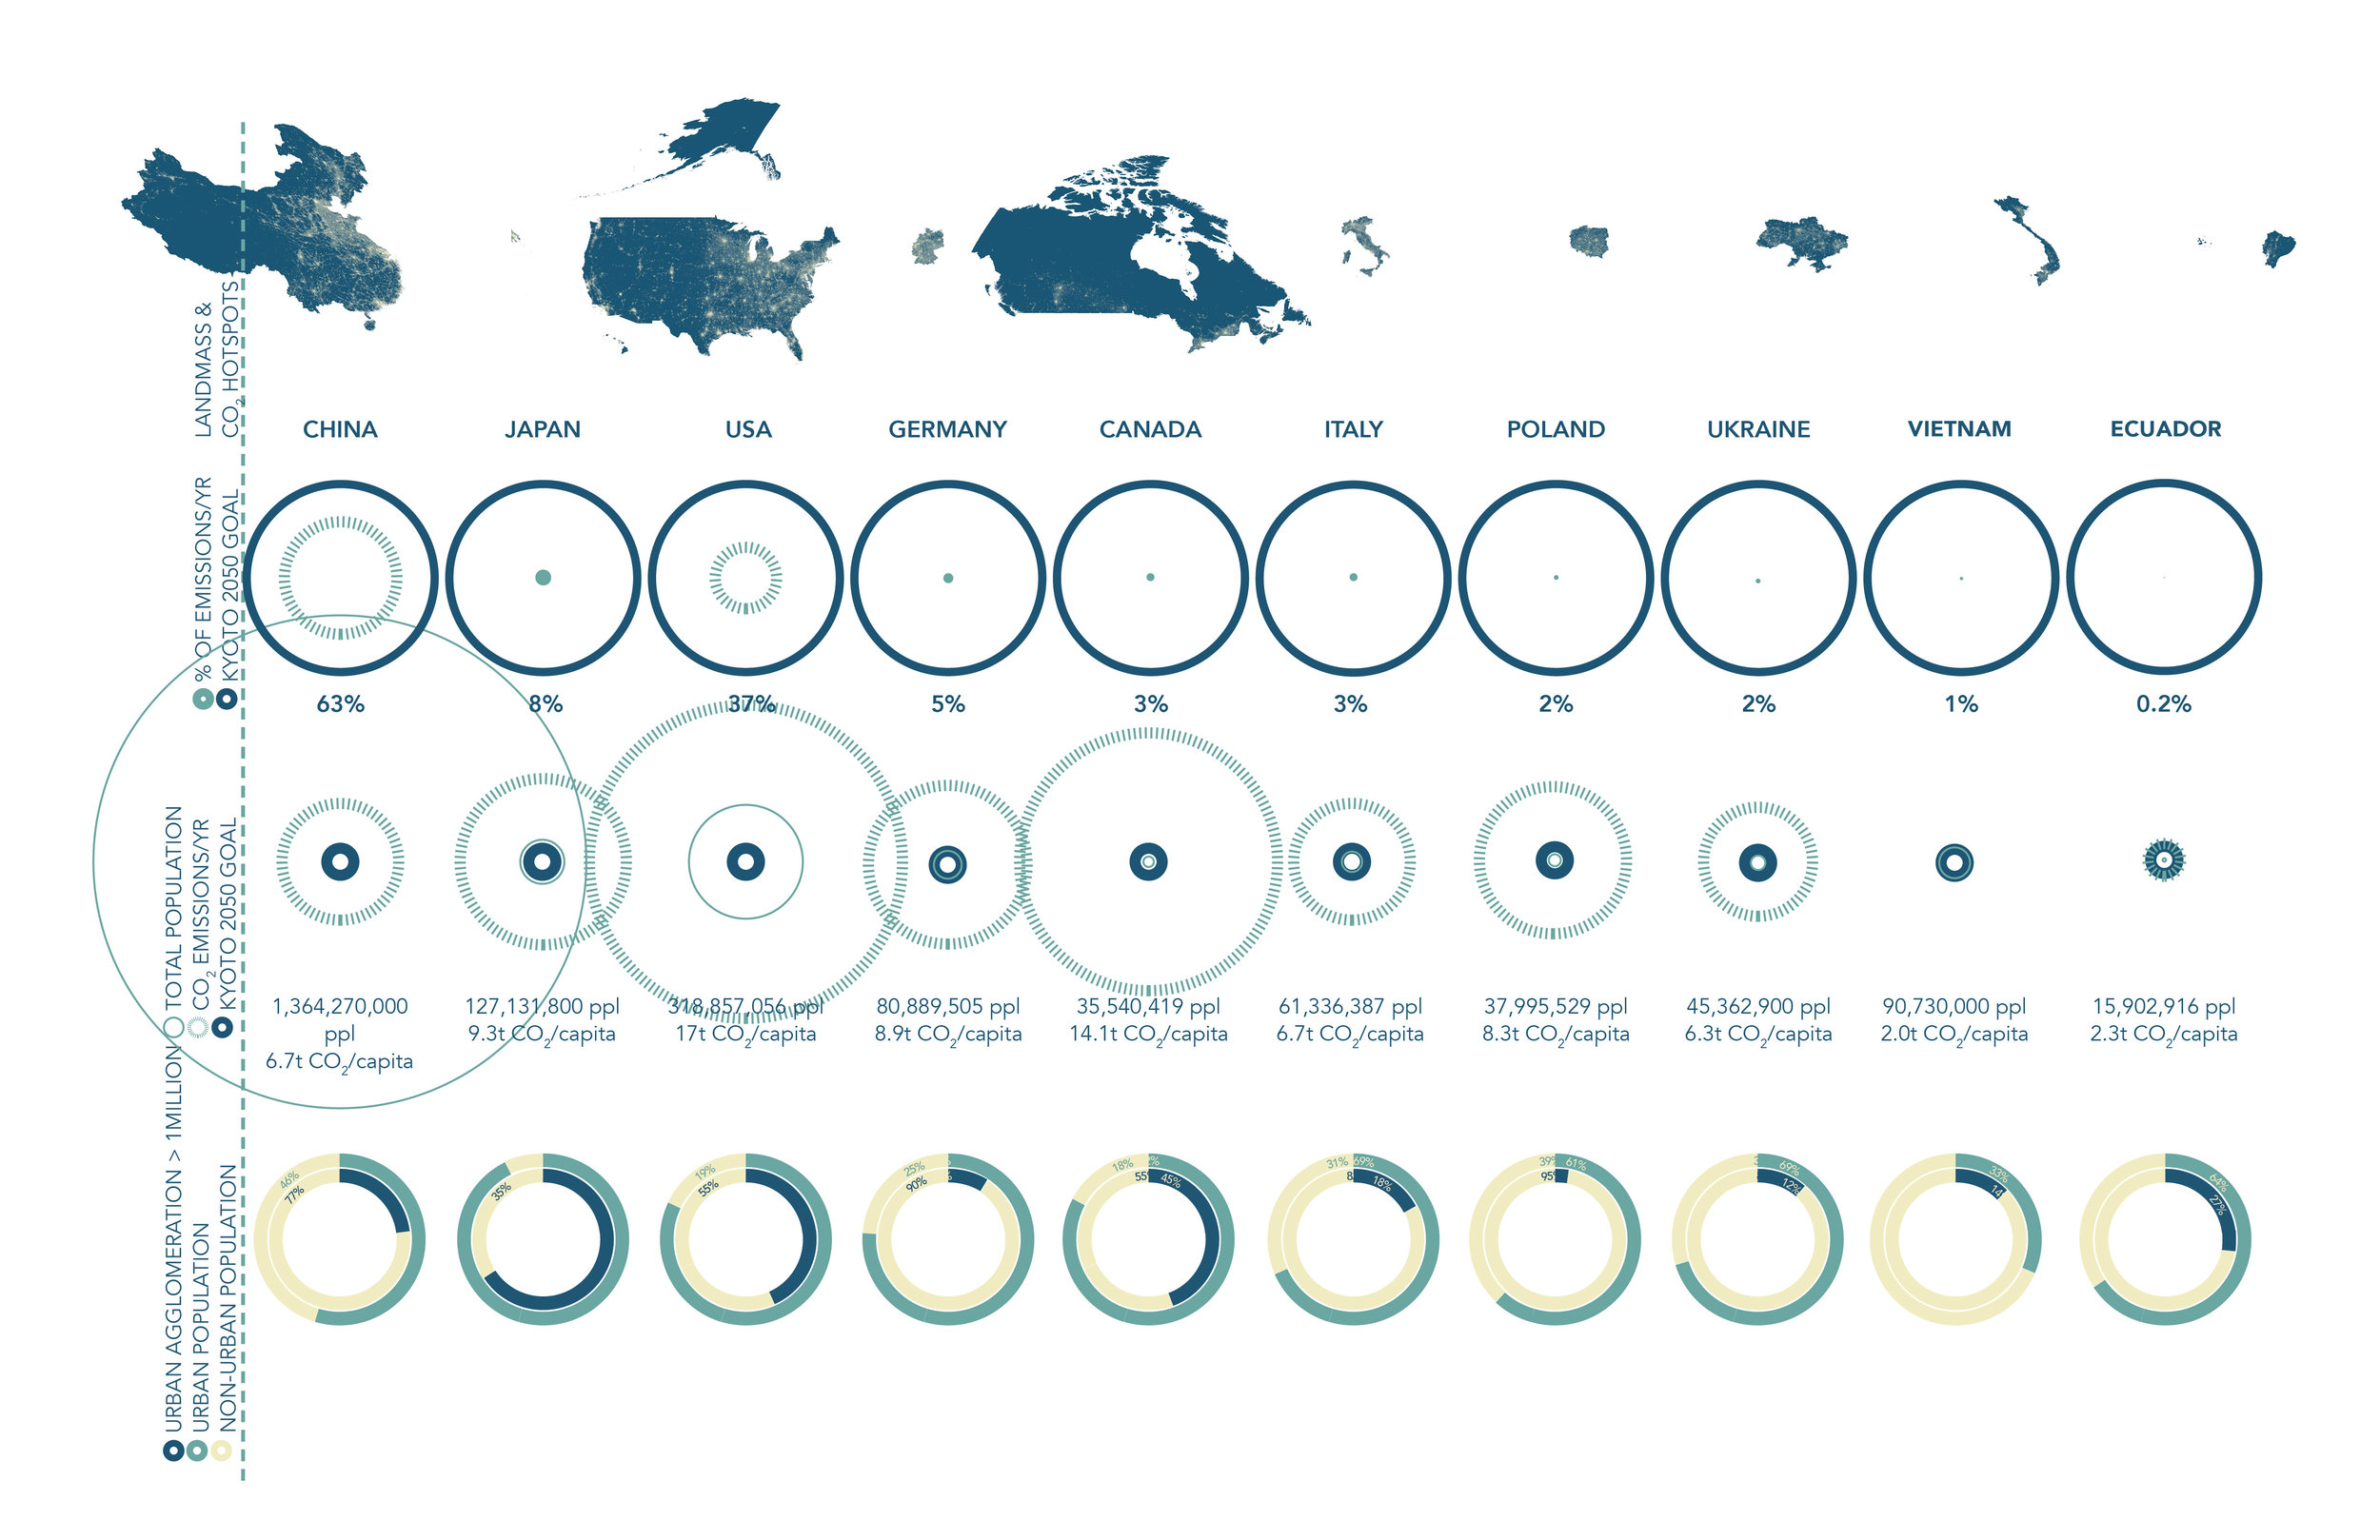
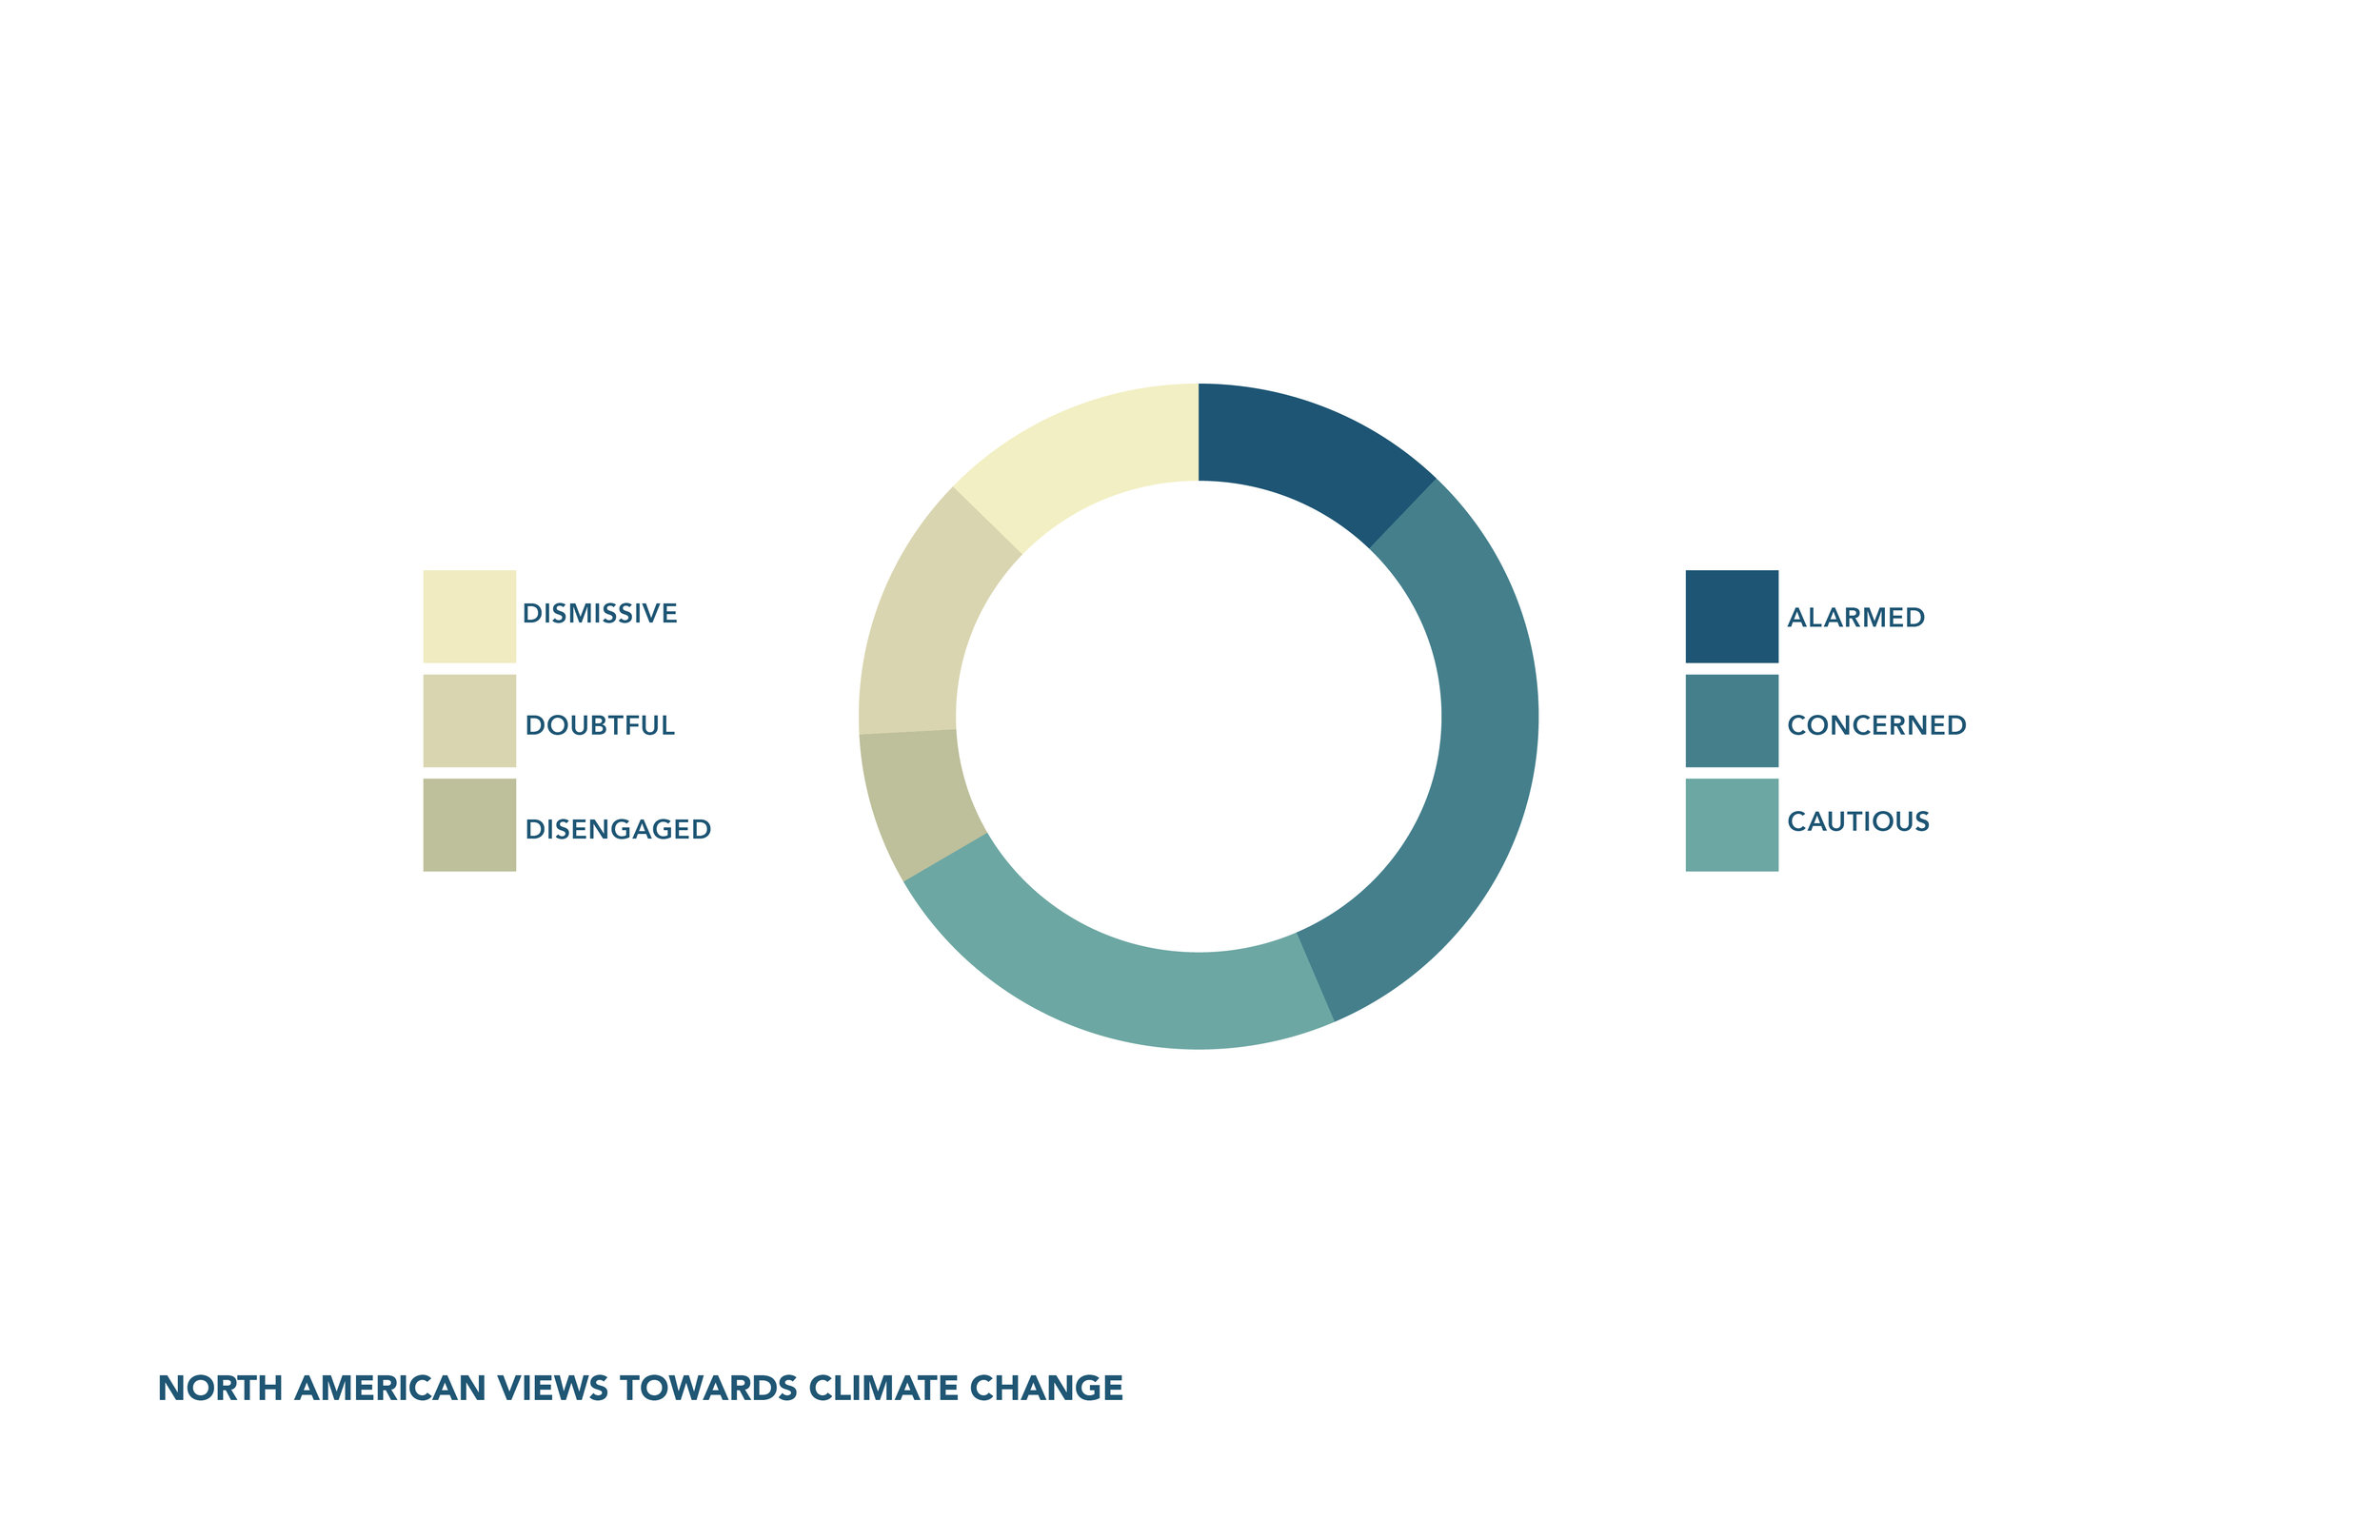
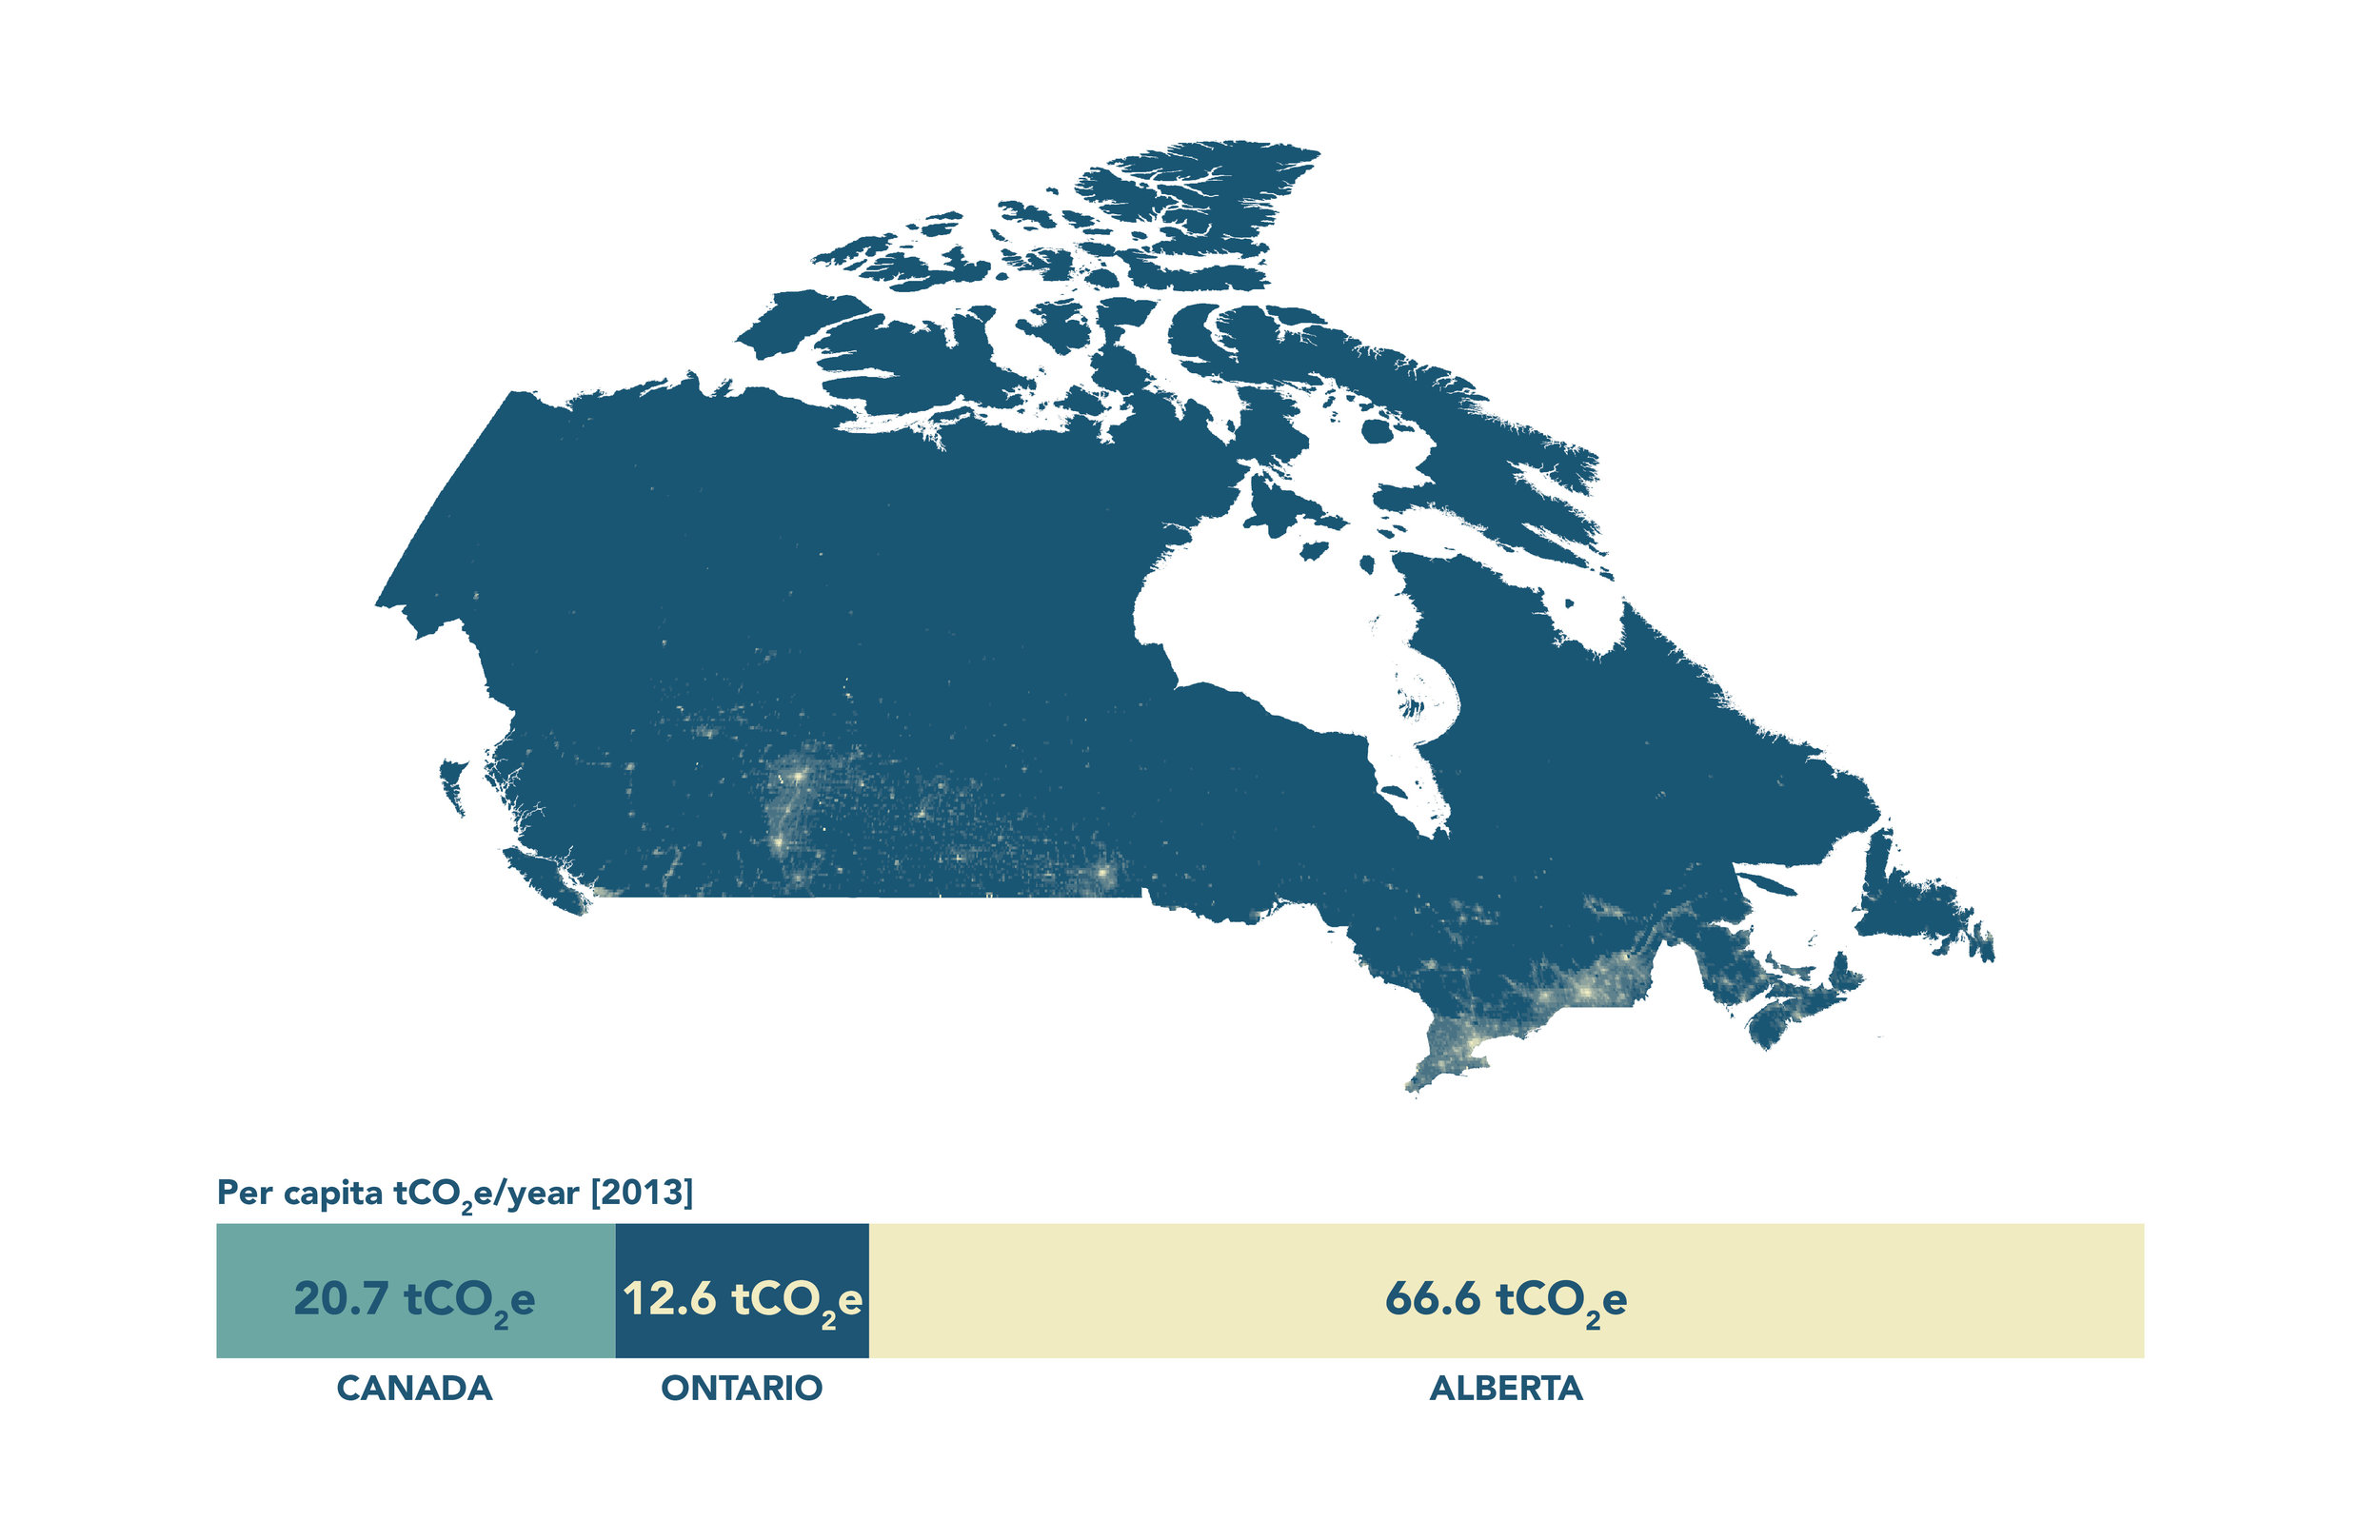
The first stage involved research into the current state of carbon emissions, from where they originate on a global scale, and narrowing down to an individual level. For the subsequent stage of research, concentration was put on areas where there is room to make adjustments on an individual level, taking into consideration the different segmentation groups with respect to their views on climate change.


02 | DESIGN
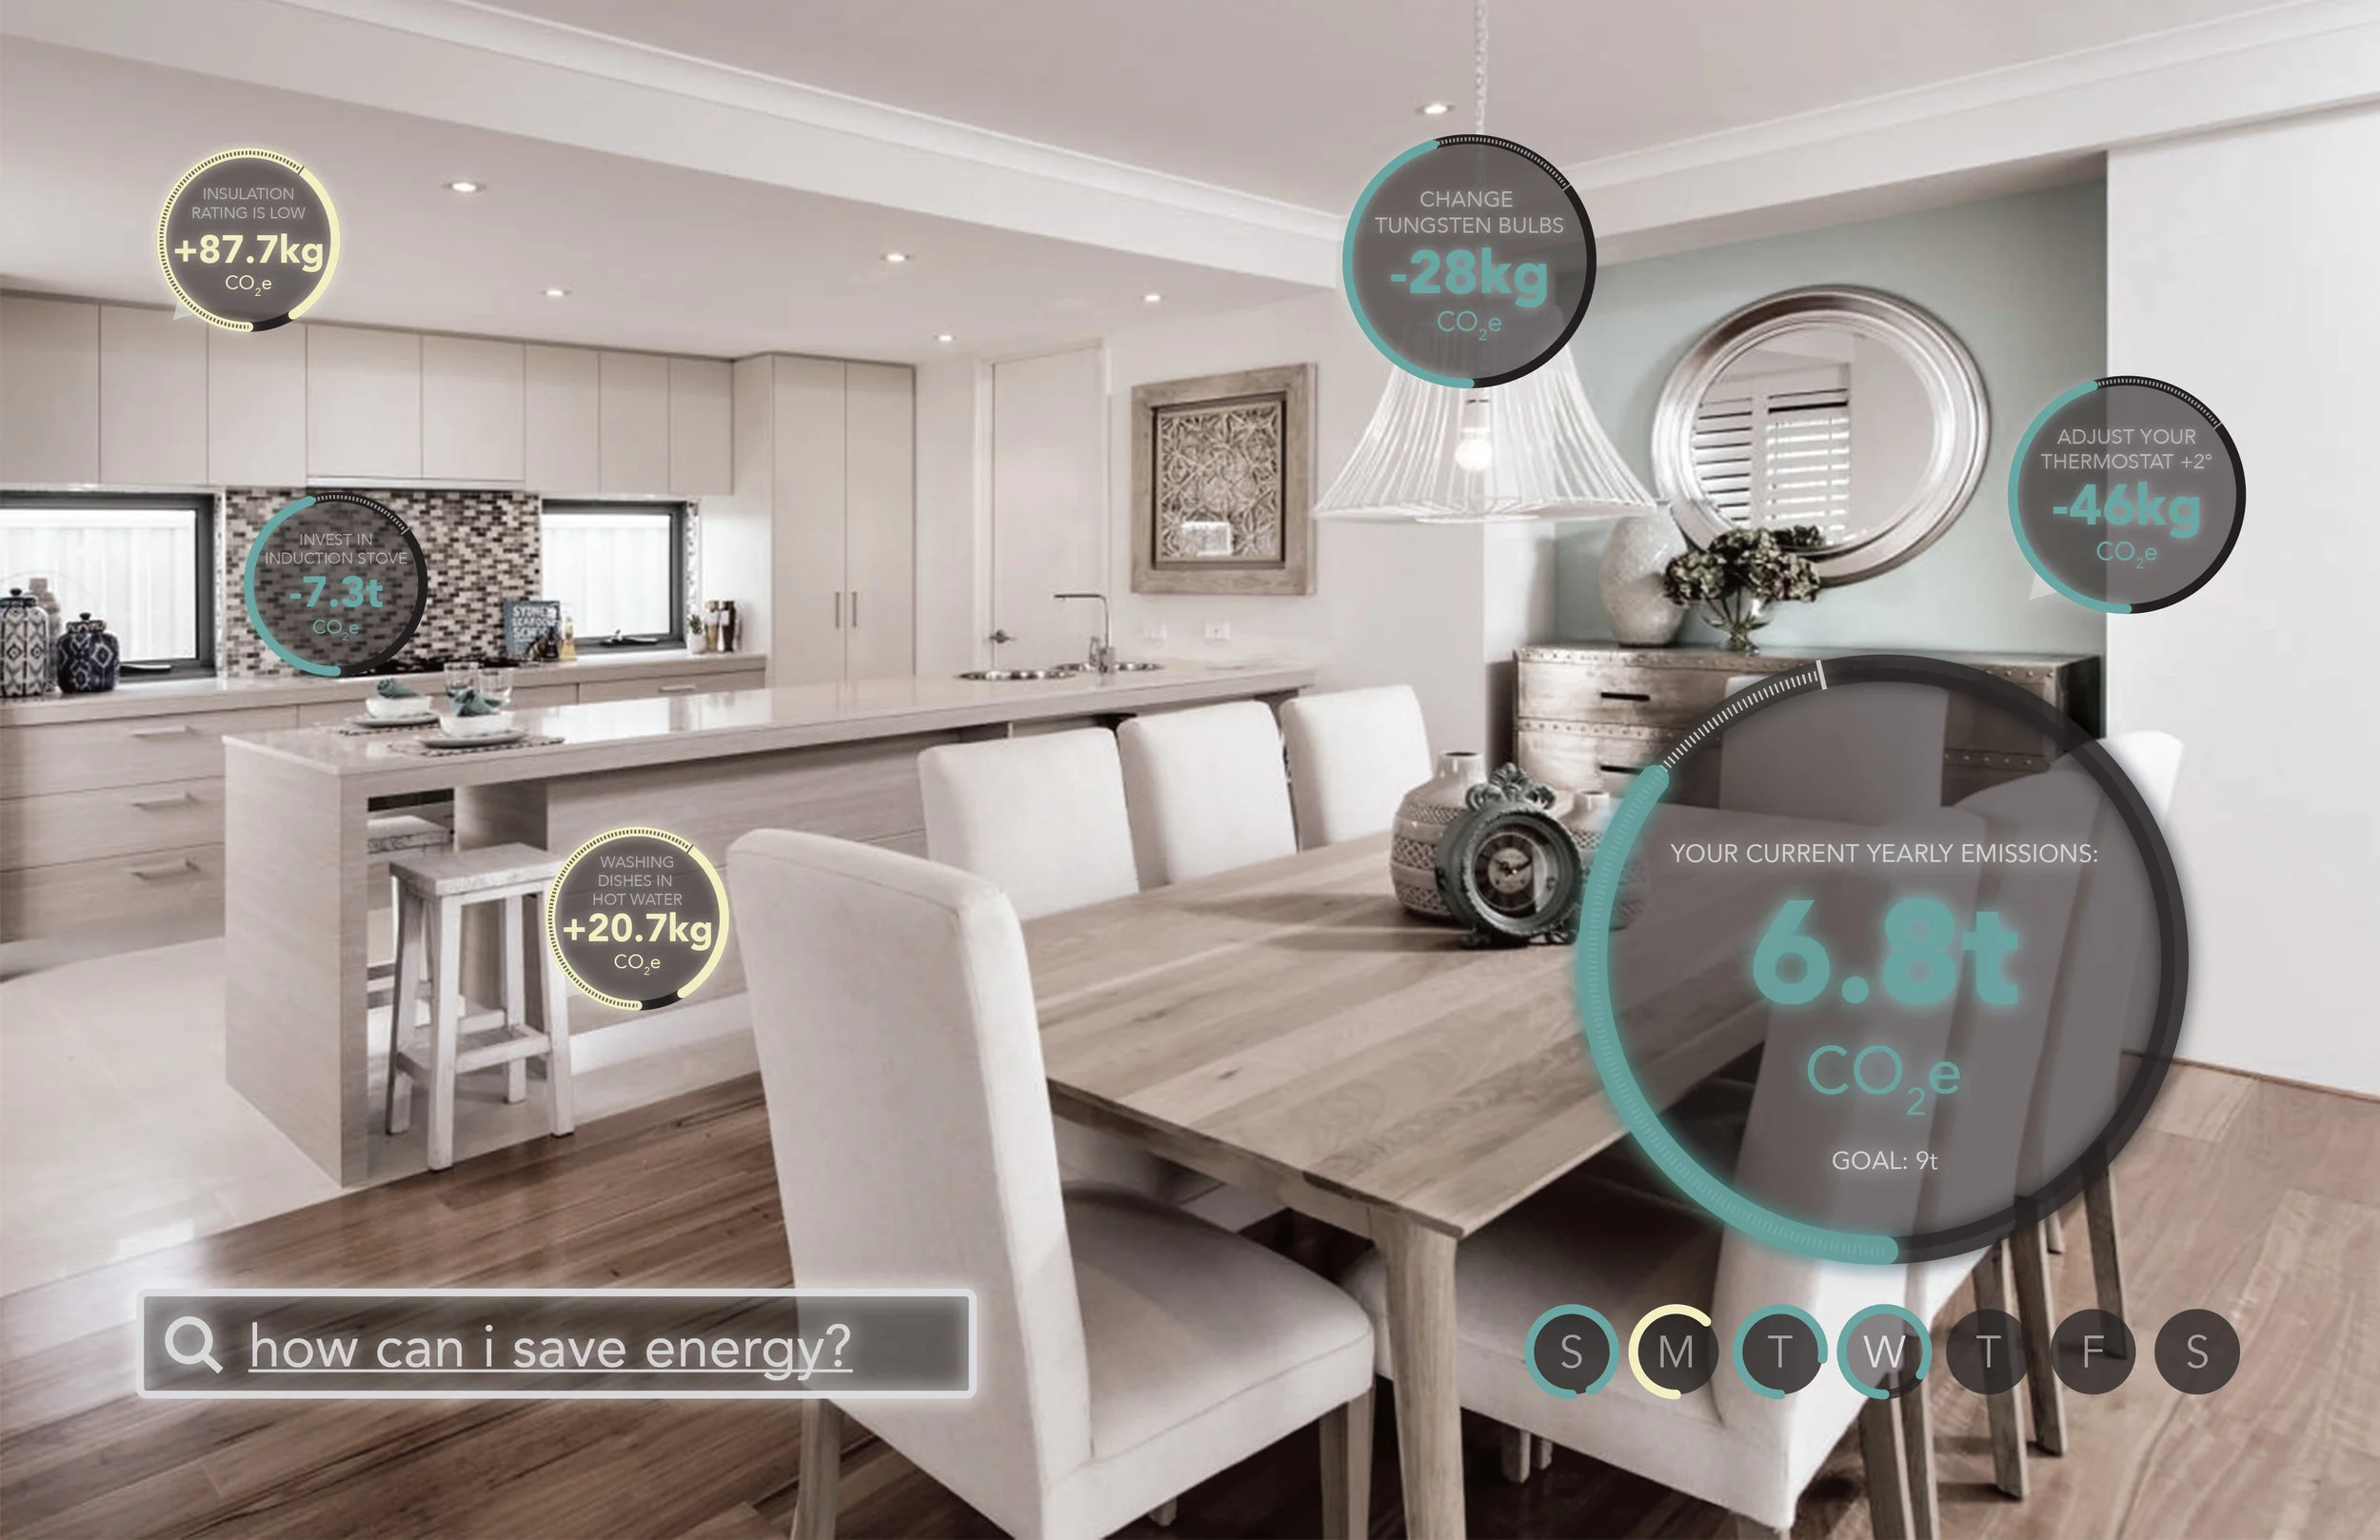
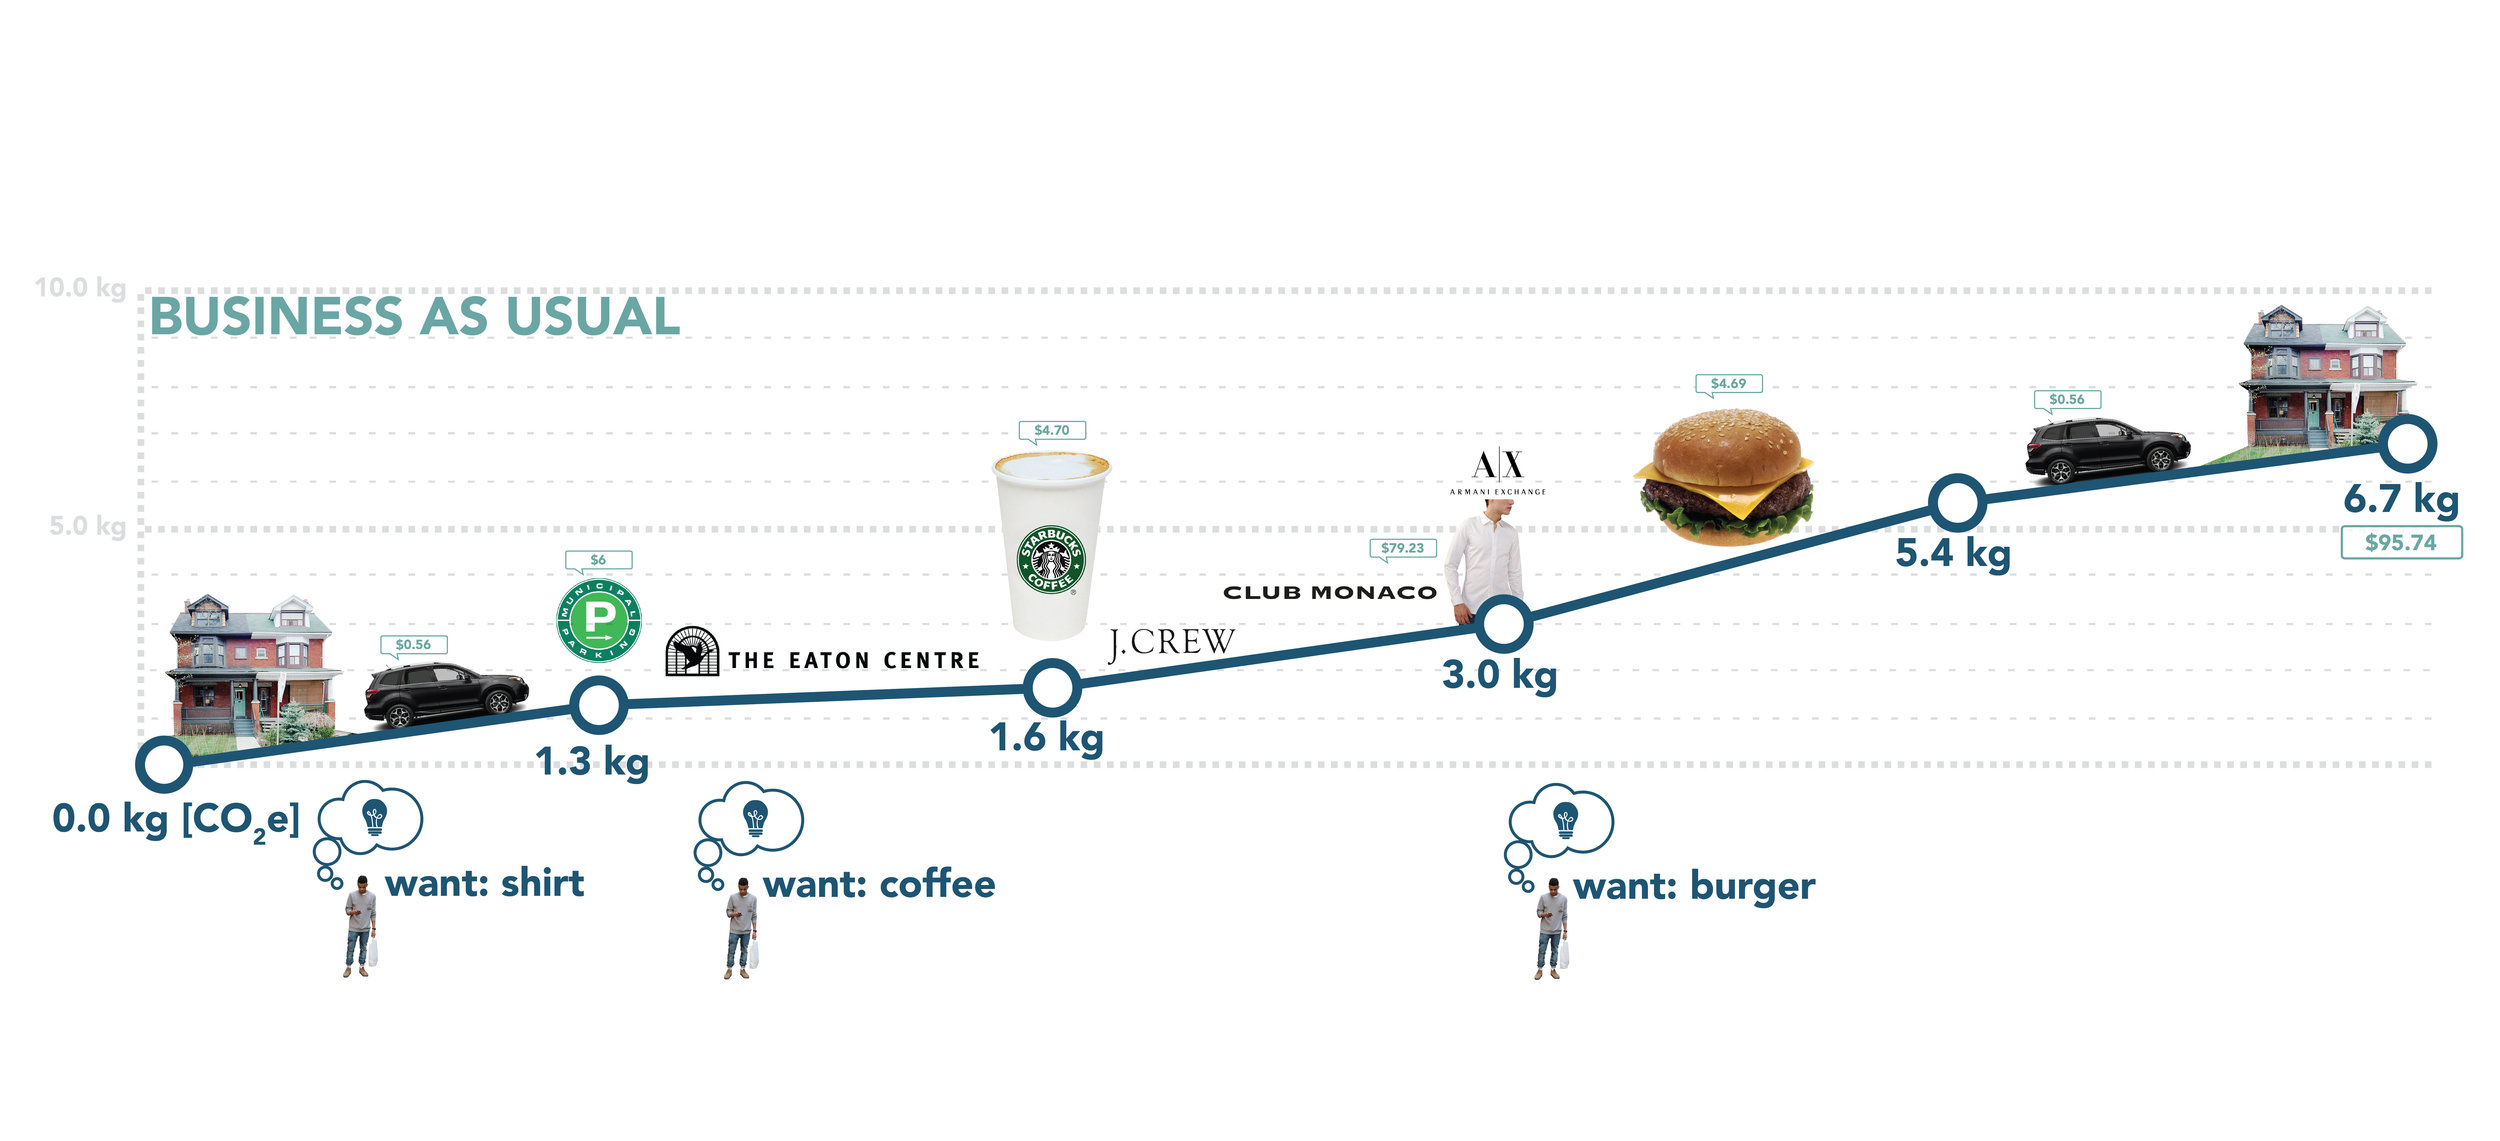
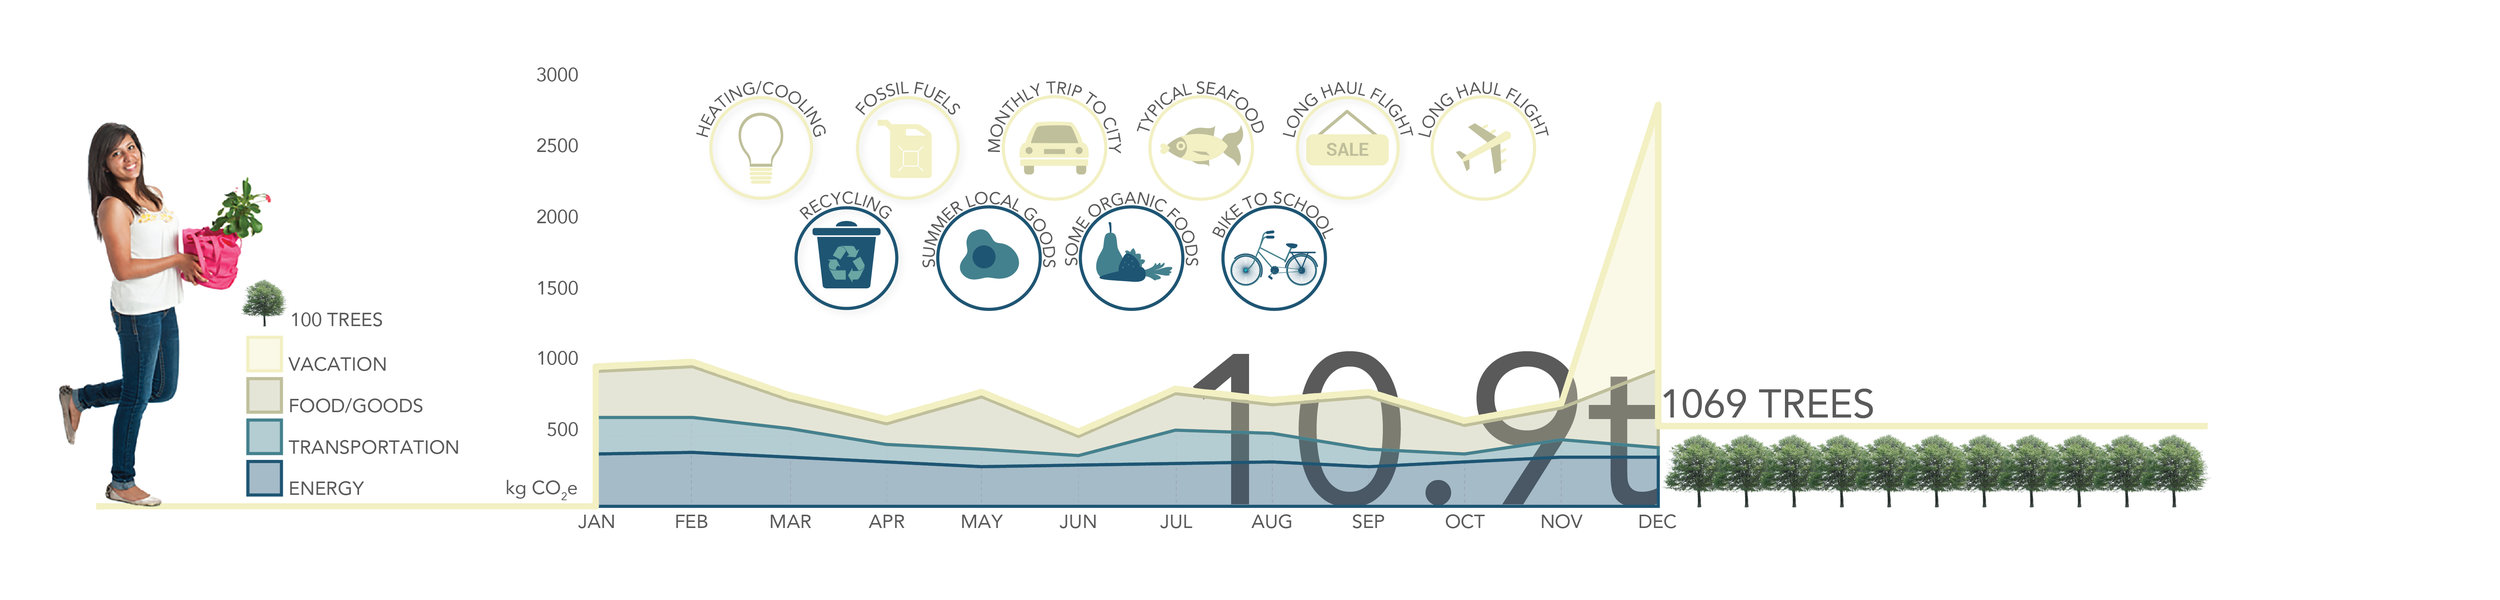
The first design of the interface explored different options to how a carbon emissions tracker could begin to affect the everyday decisions an individual encounters. They are all based on tracking the carbon footprint total of everything the user requires, from food consumption, shopping, travel methods, and energy use. From this value, various adjustments in decisions can be made from evaluating options that the user has and the impact that those option would have on their existing value.


03 | SURVEY
Following the initial design, a survey was run to gauge the openness of respondents to the tracking of various areas required to make the platform feasible. An online polling service, Pollfish, was used to target respondents from the Greater Toronto Area. It was found that while a majority of the respondents felt that more could be done by the individual to lower carbon emissions, they were most open to having their groceries tracked above all other categories. As a result, further development of the features would put an emphasis on the user's food consumption.
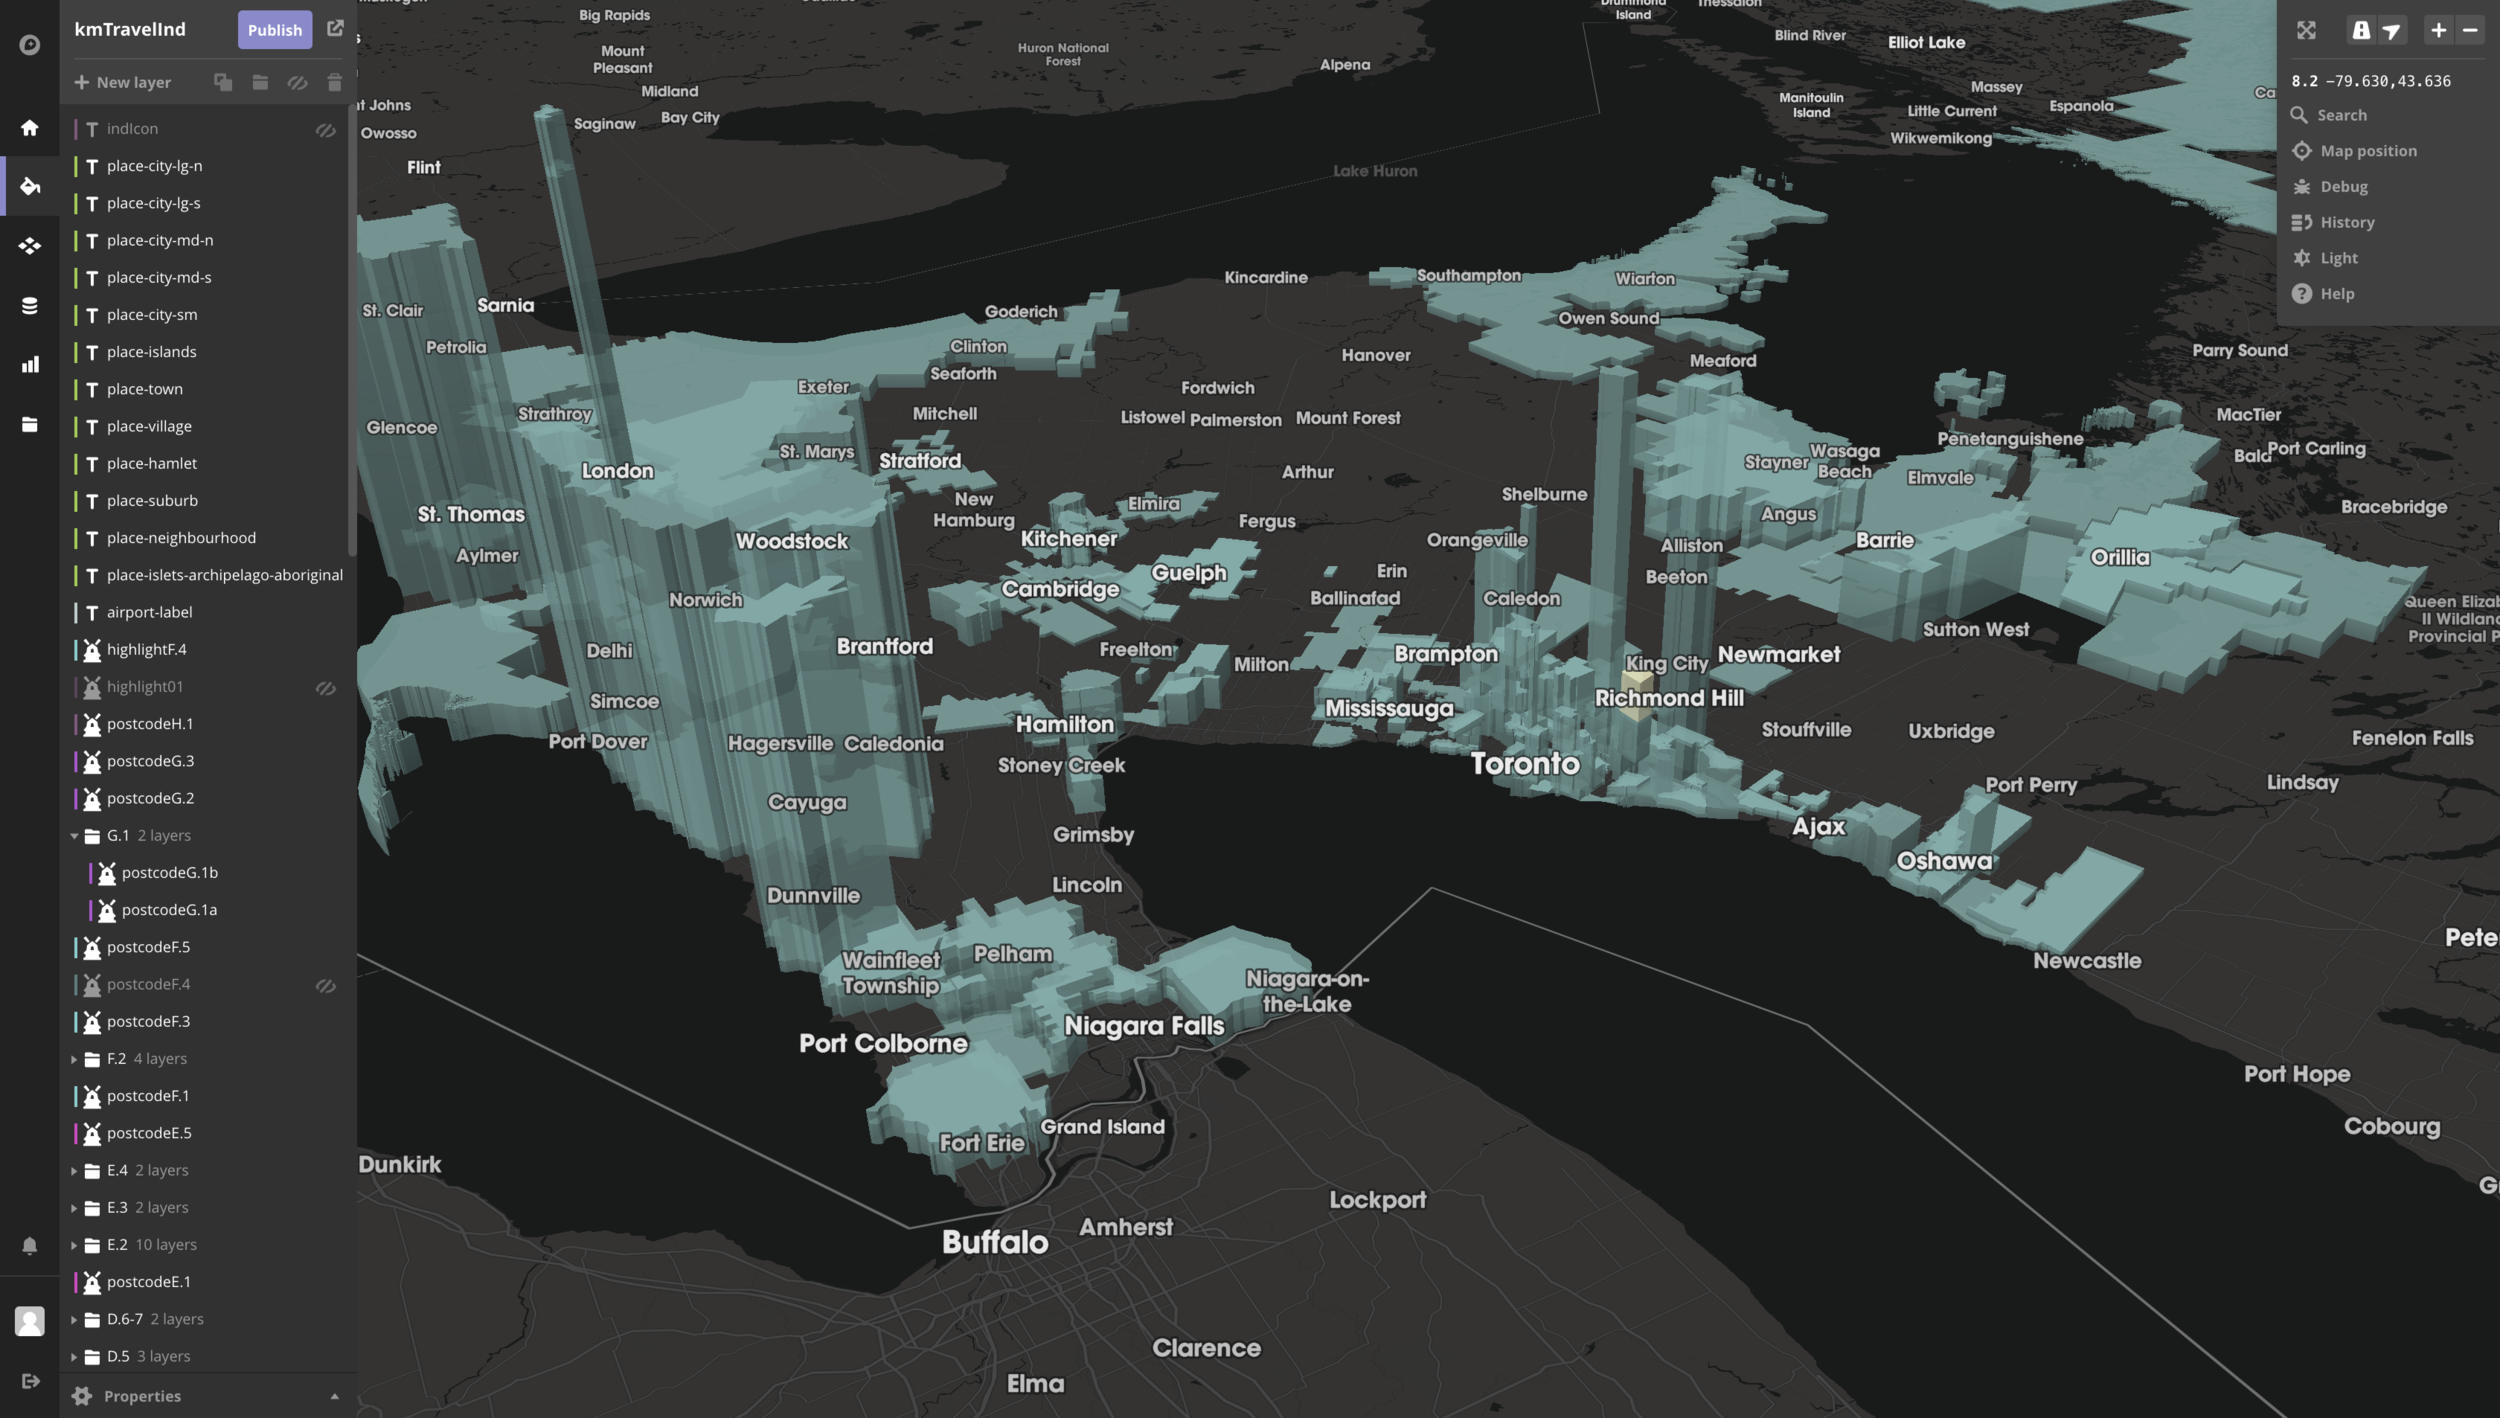
Additionally, survey respondents were asked about their weekly travel amount by car and their location by postal code. Results were use to create a database for the map visualization of local carbon emissions for the prototypes.

04 | USER FLOWS & PROTOTYPING
Before the creation of the prototypes, flow charts of the user experience were created to organize the structure of the three different prototypes.
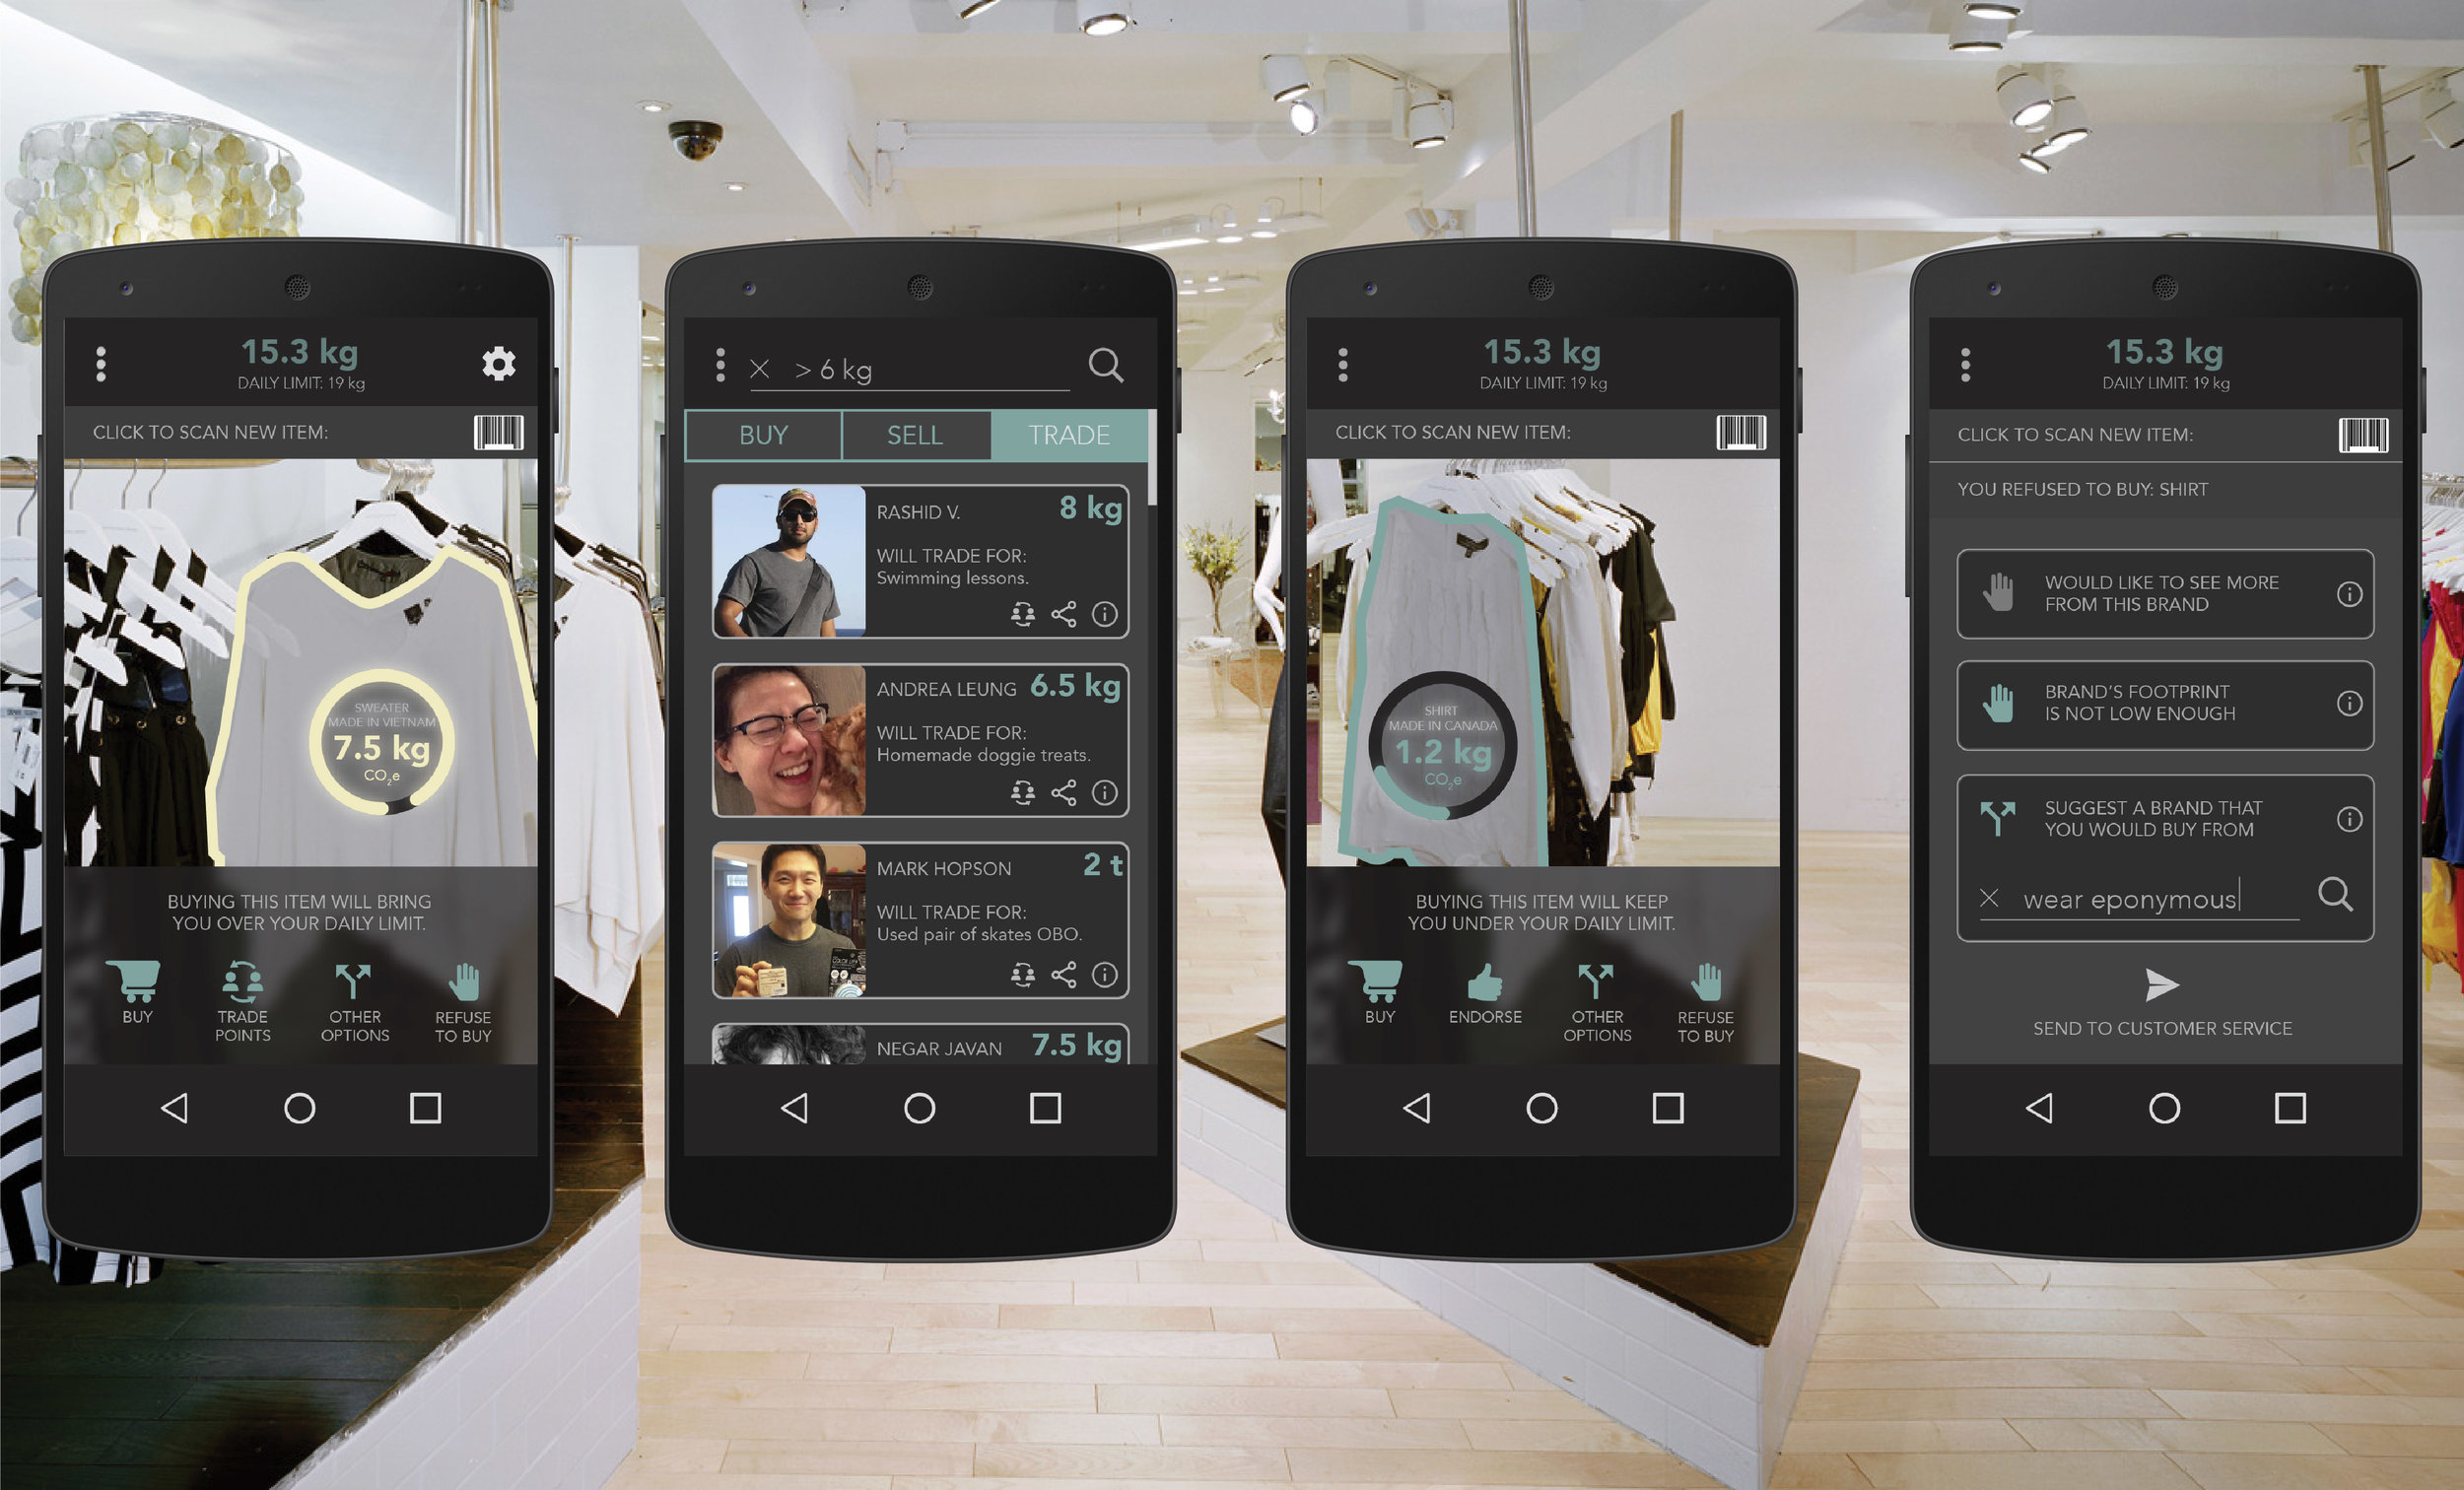
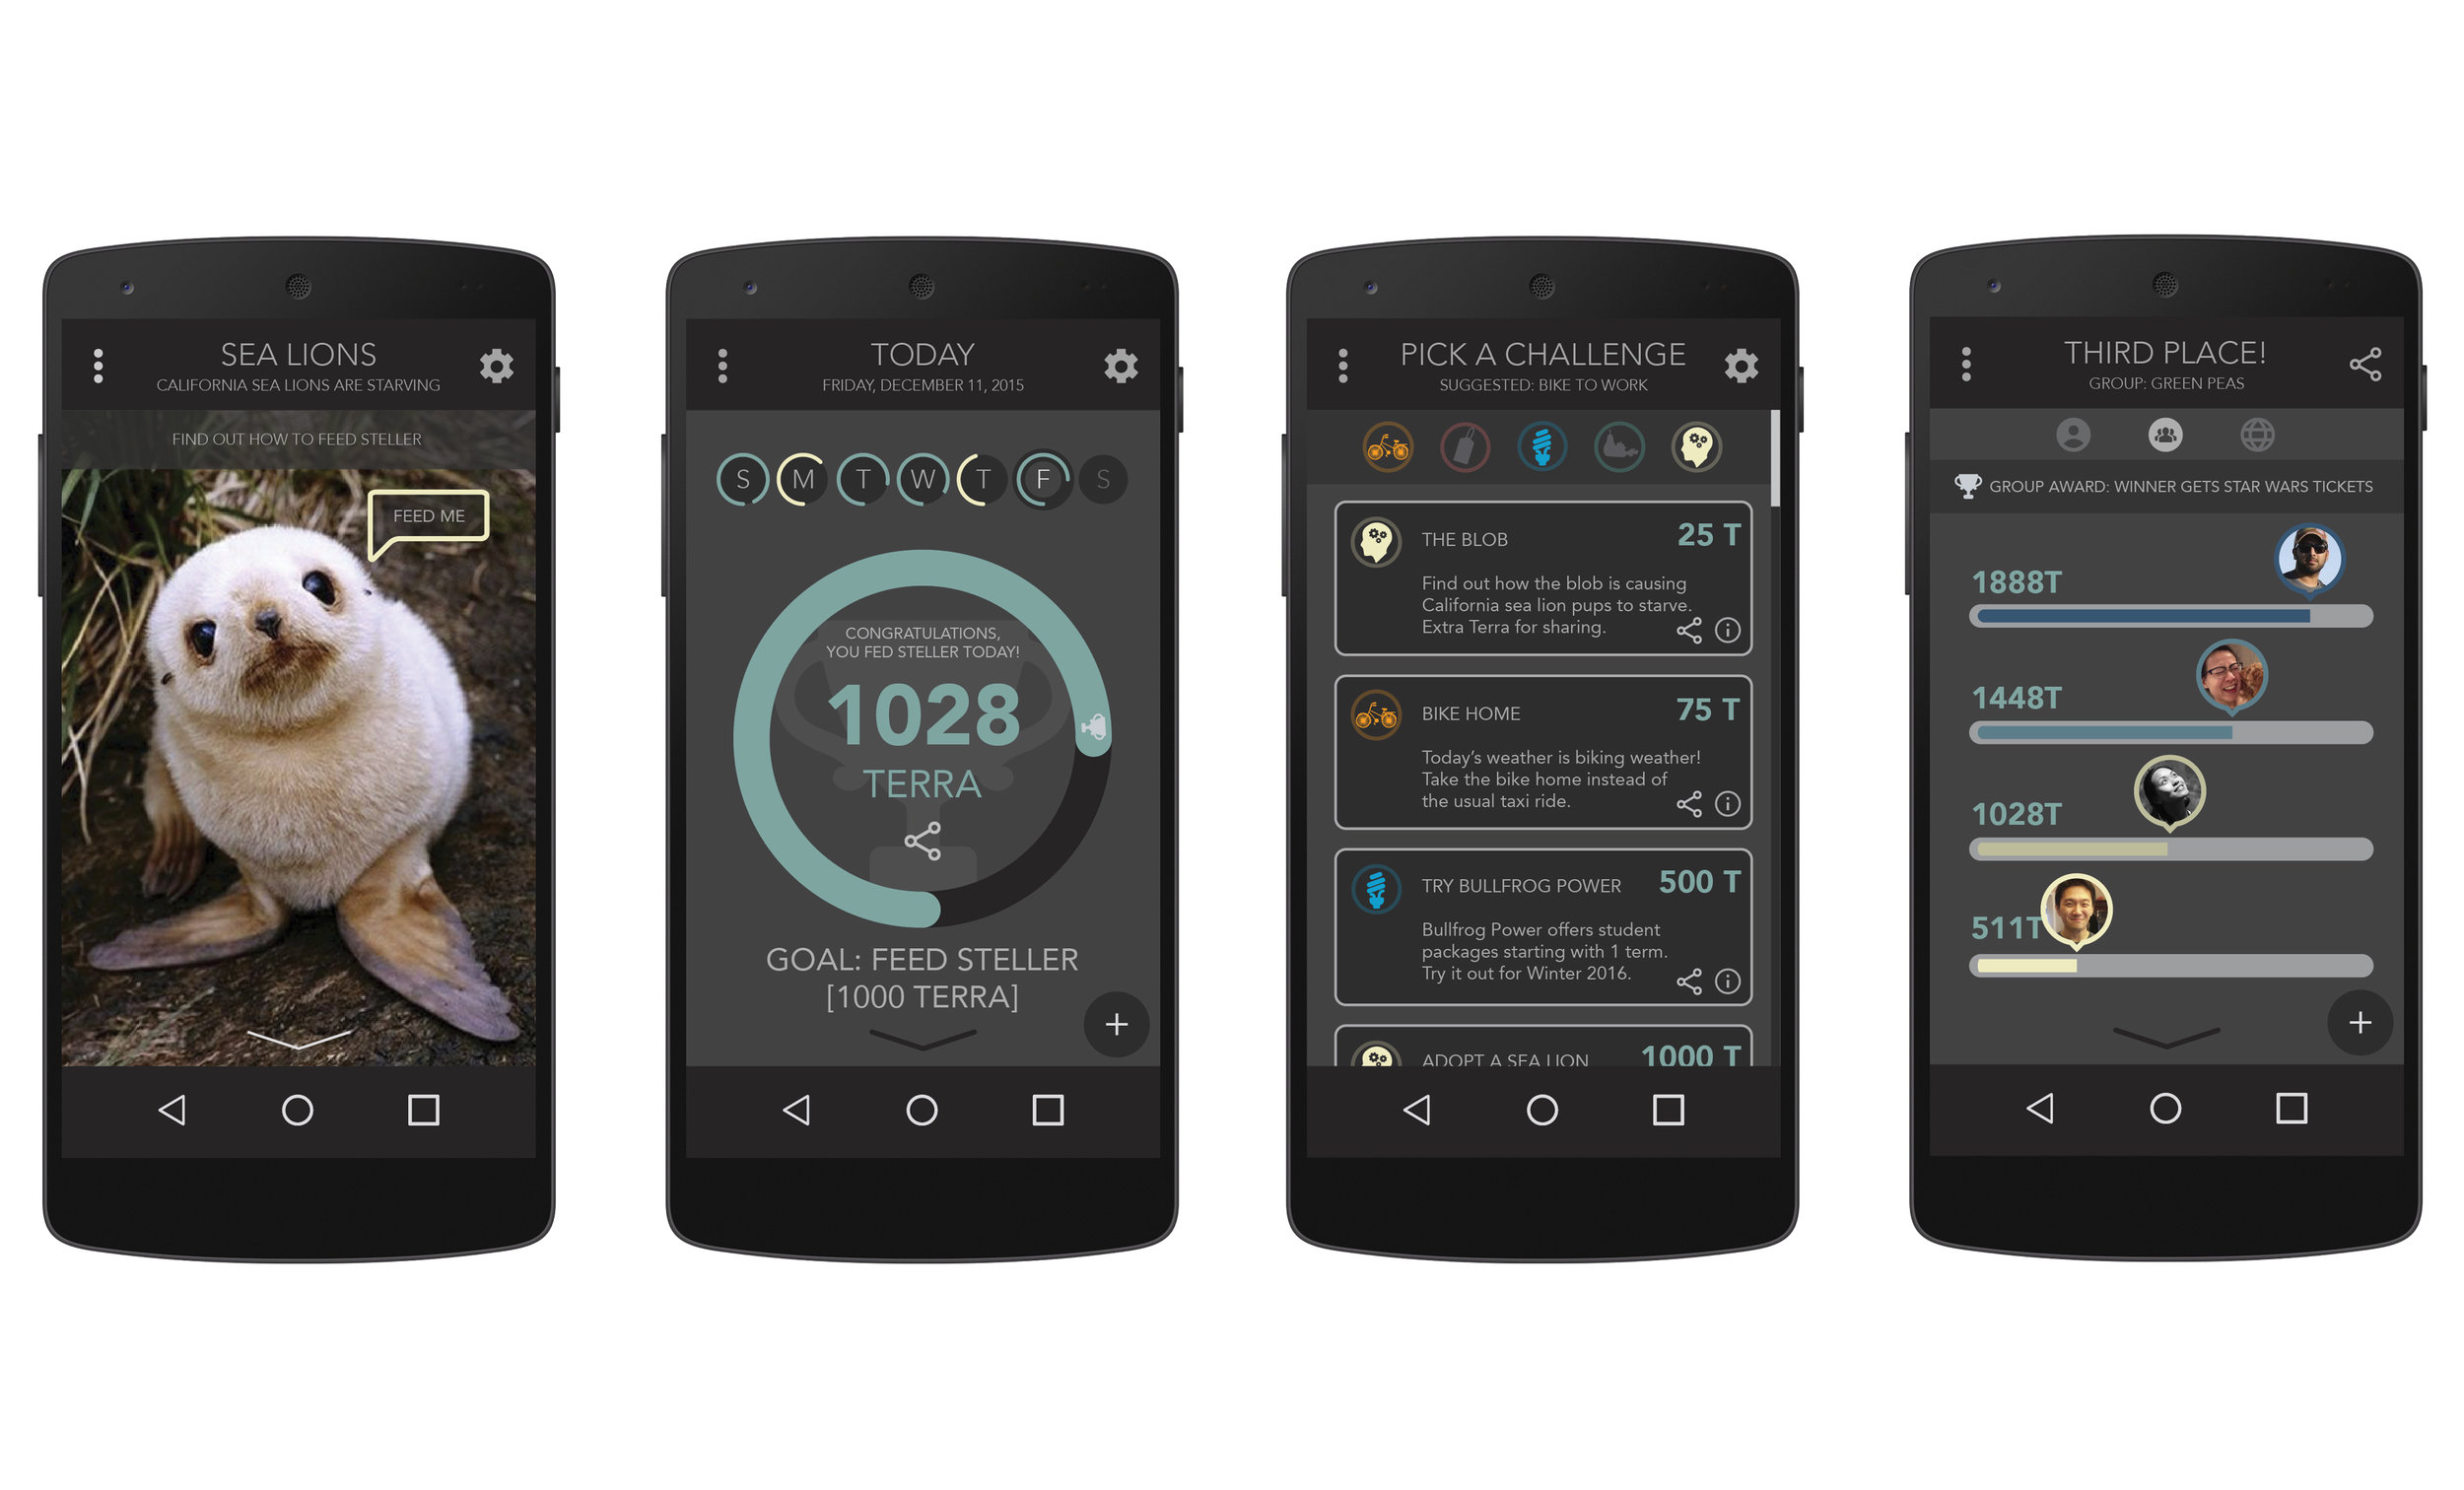
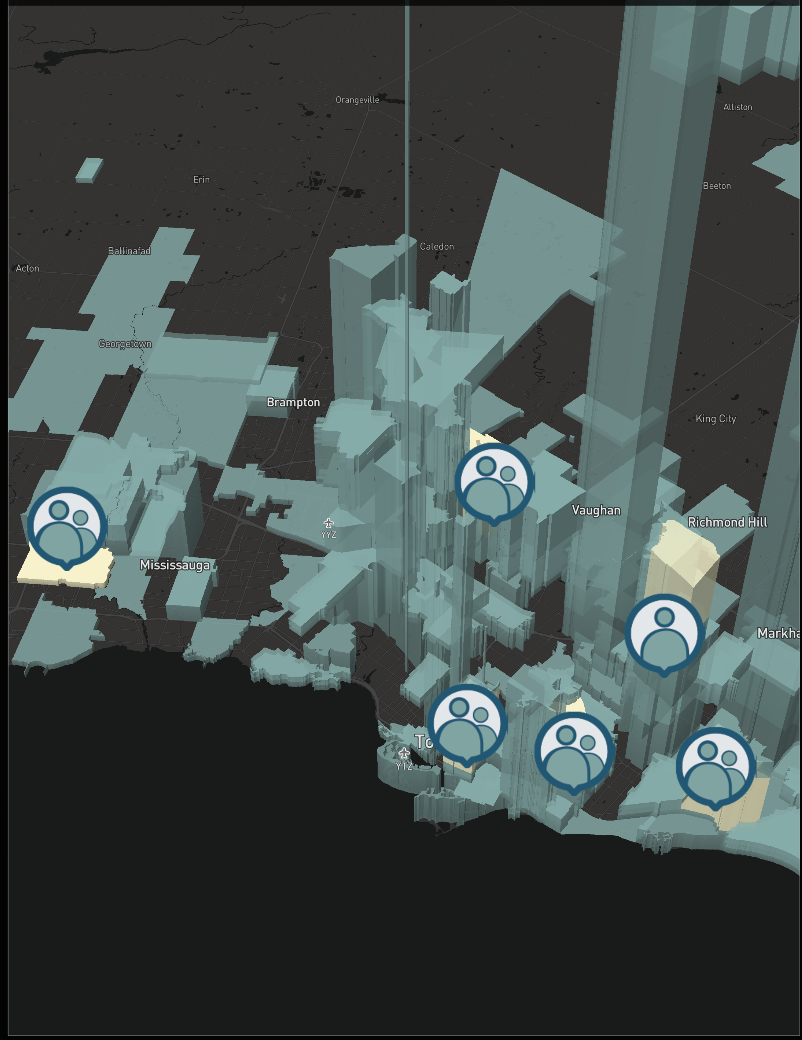
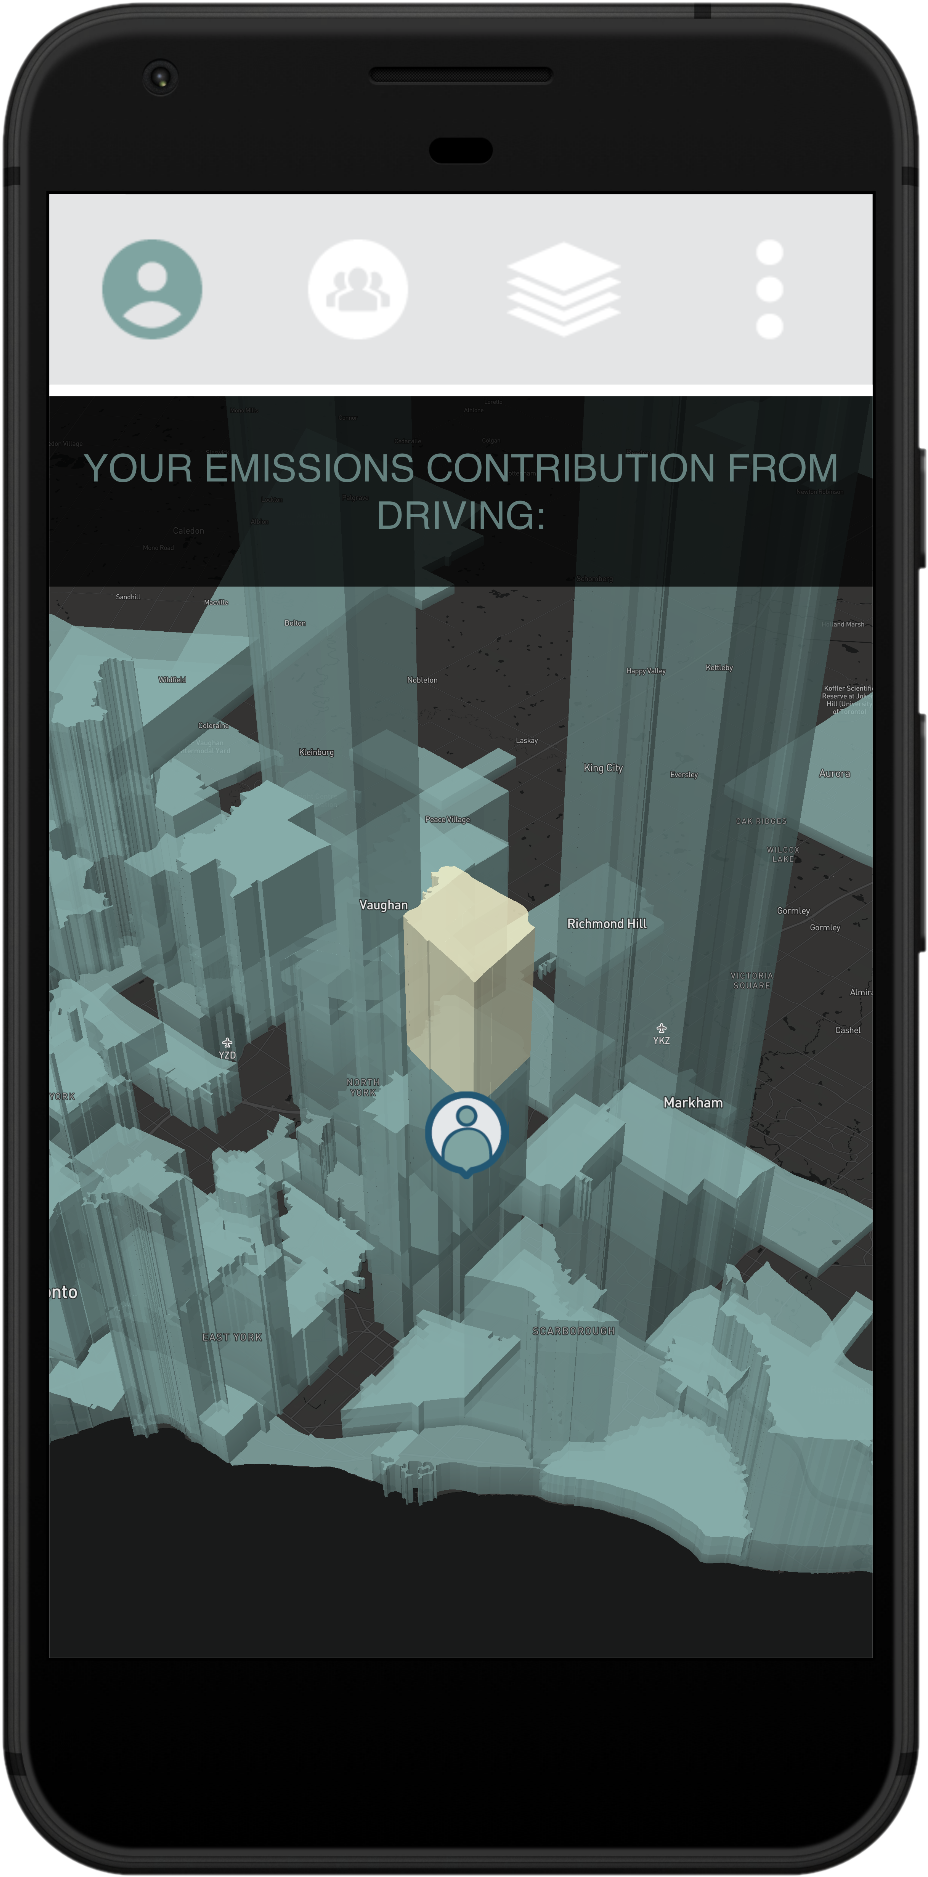
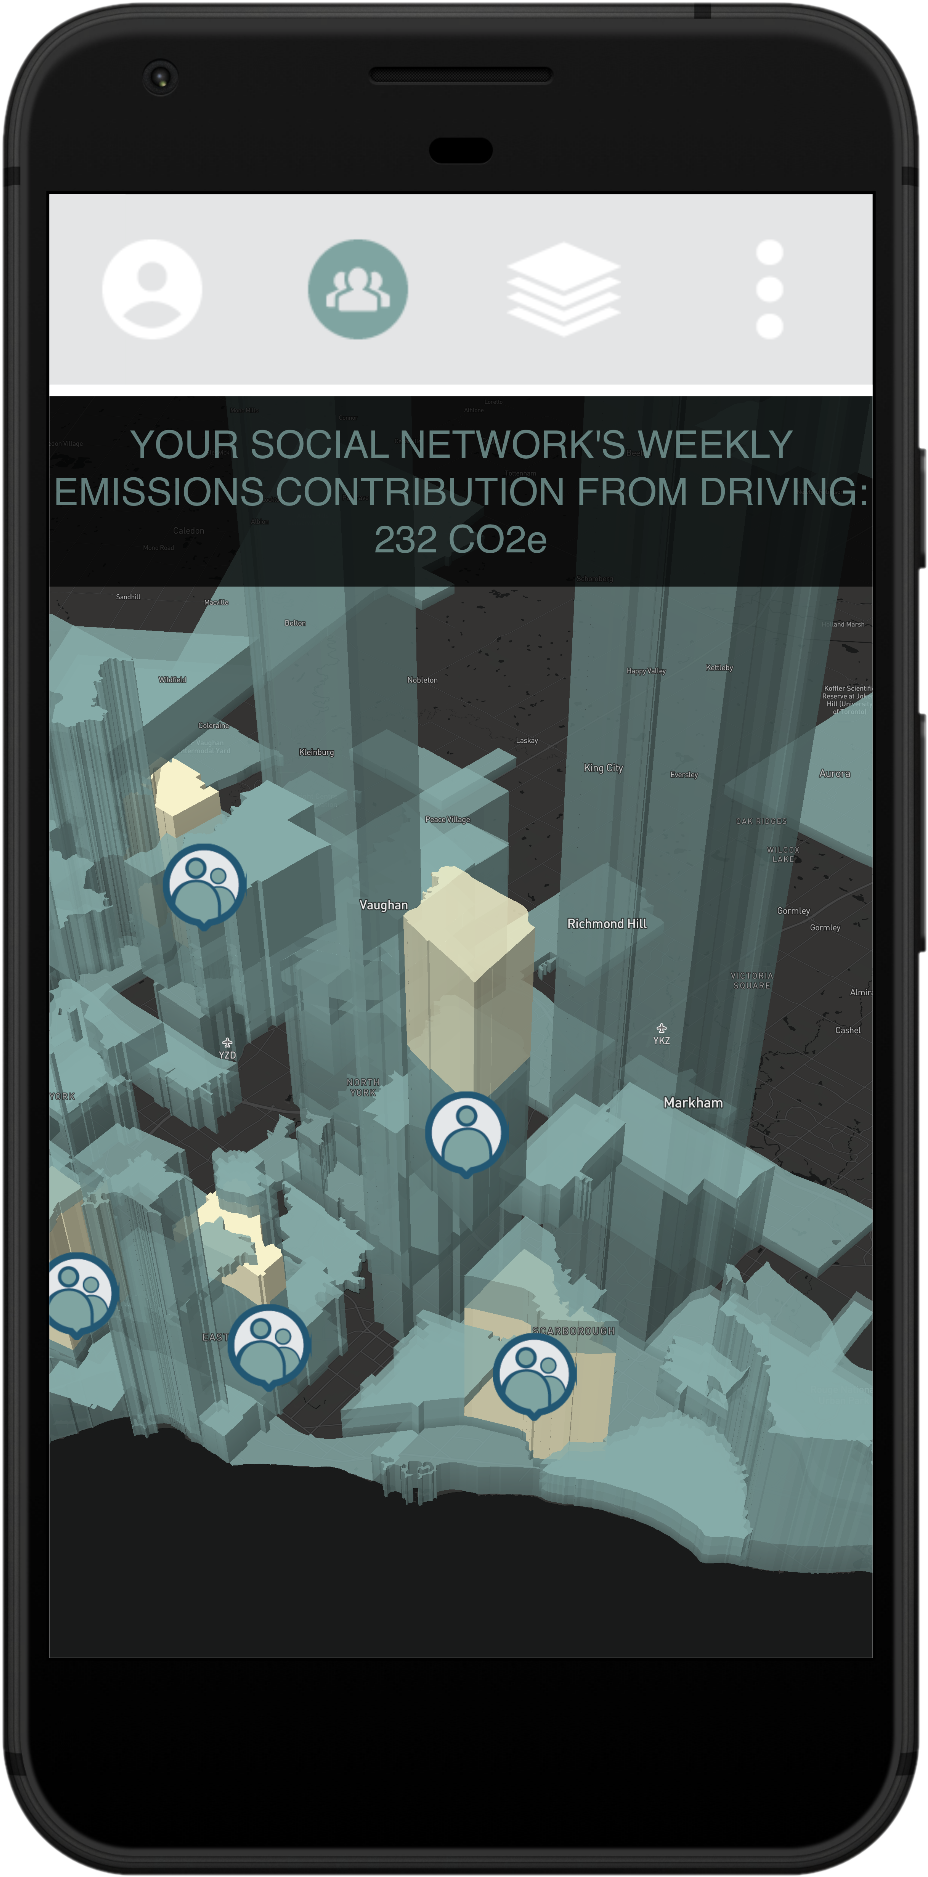
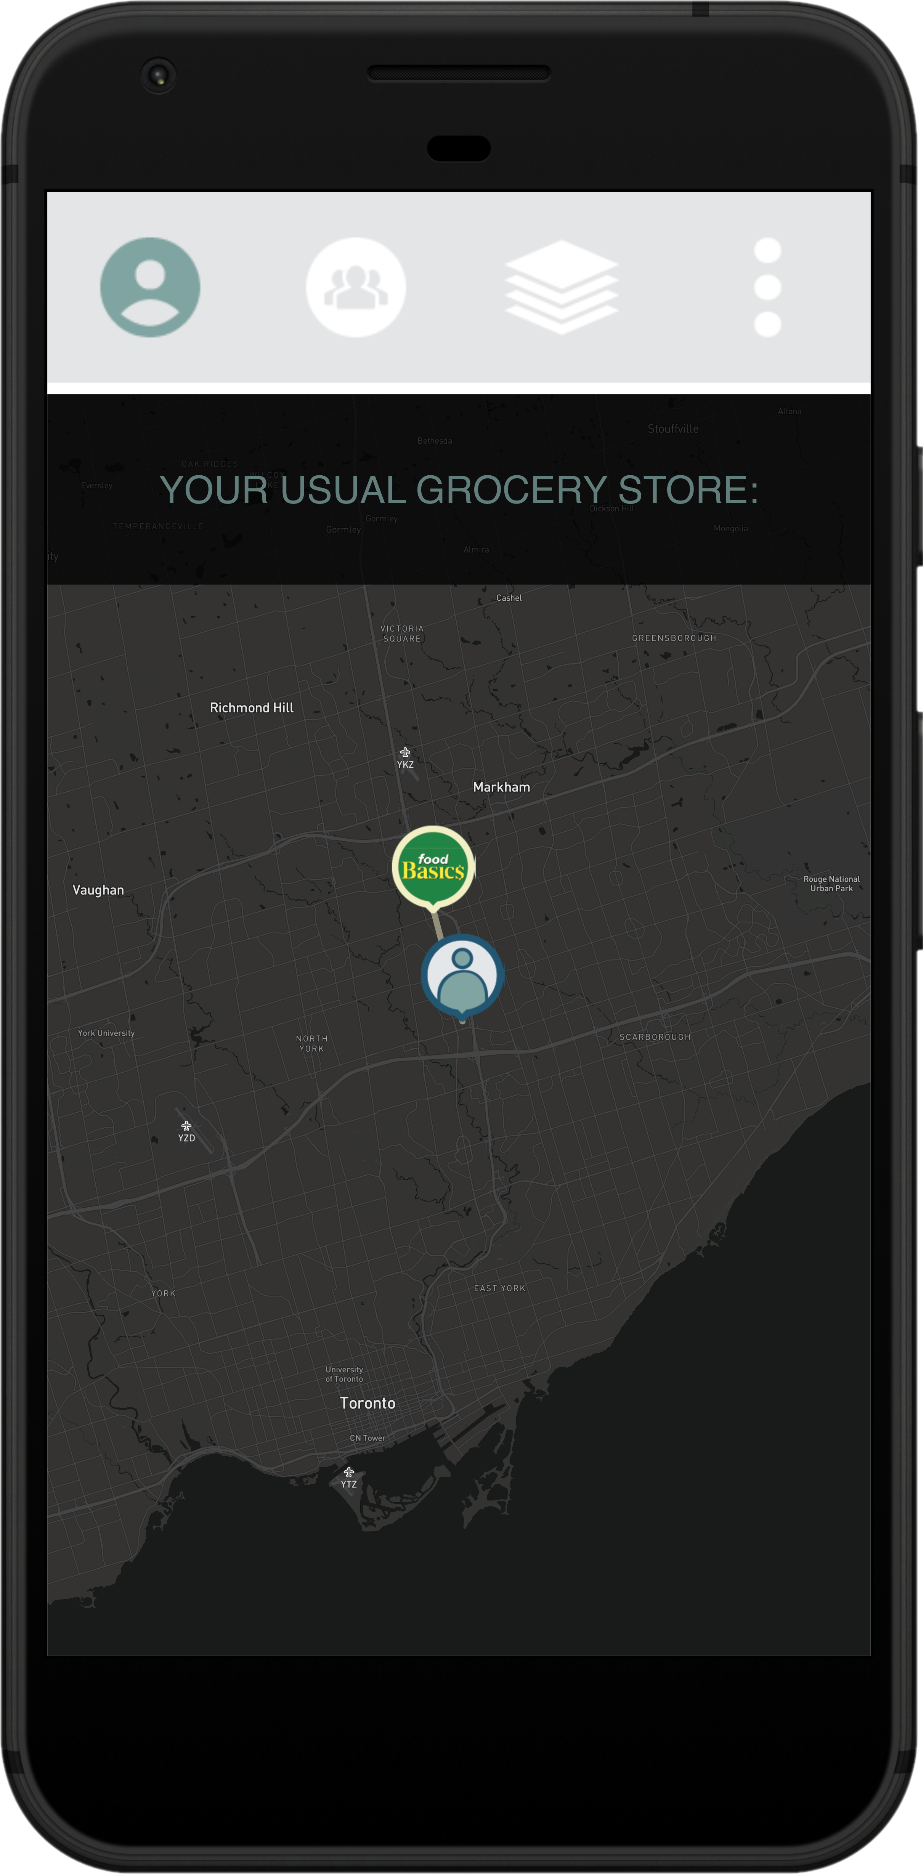
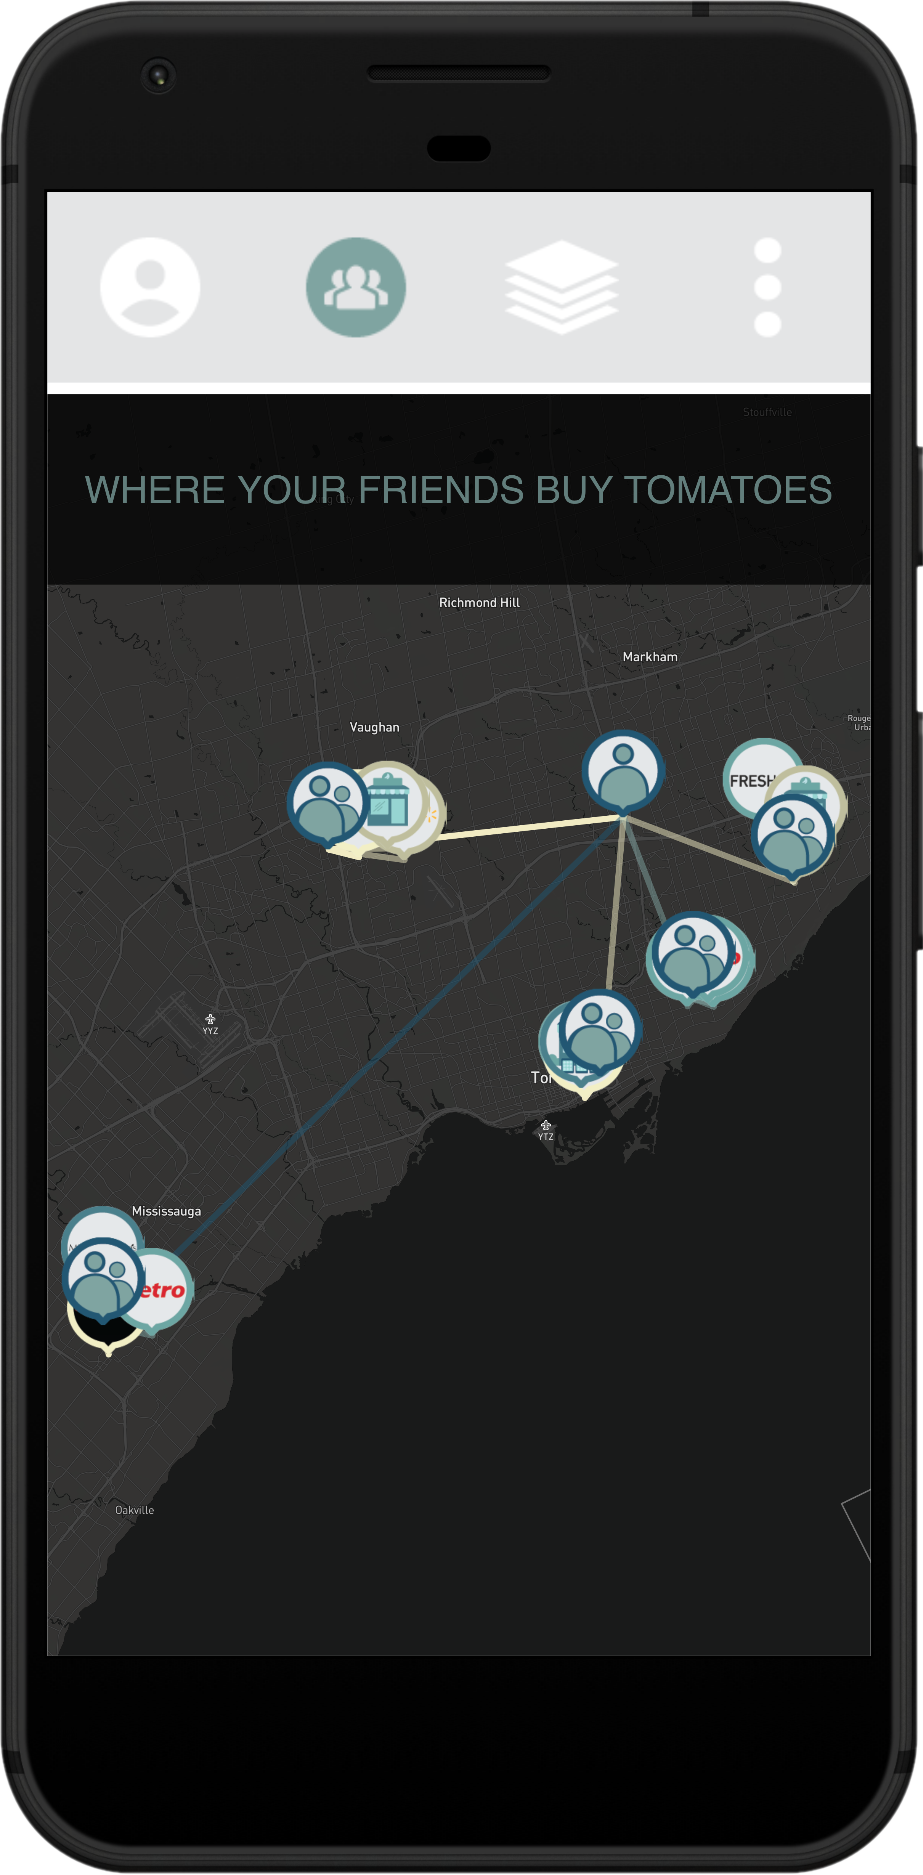
The prototypes were then created with Framer. This software was chosen for its ability to integrate Mapbox and its mapping visualizations into the prototypes in order to give users in the user testing stage a realistic experience with viewing the carbon footprints of those within the surrounding communities.


Prototype One
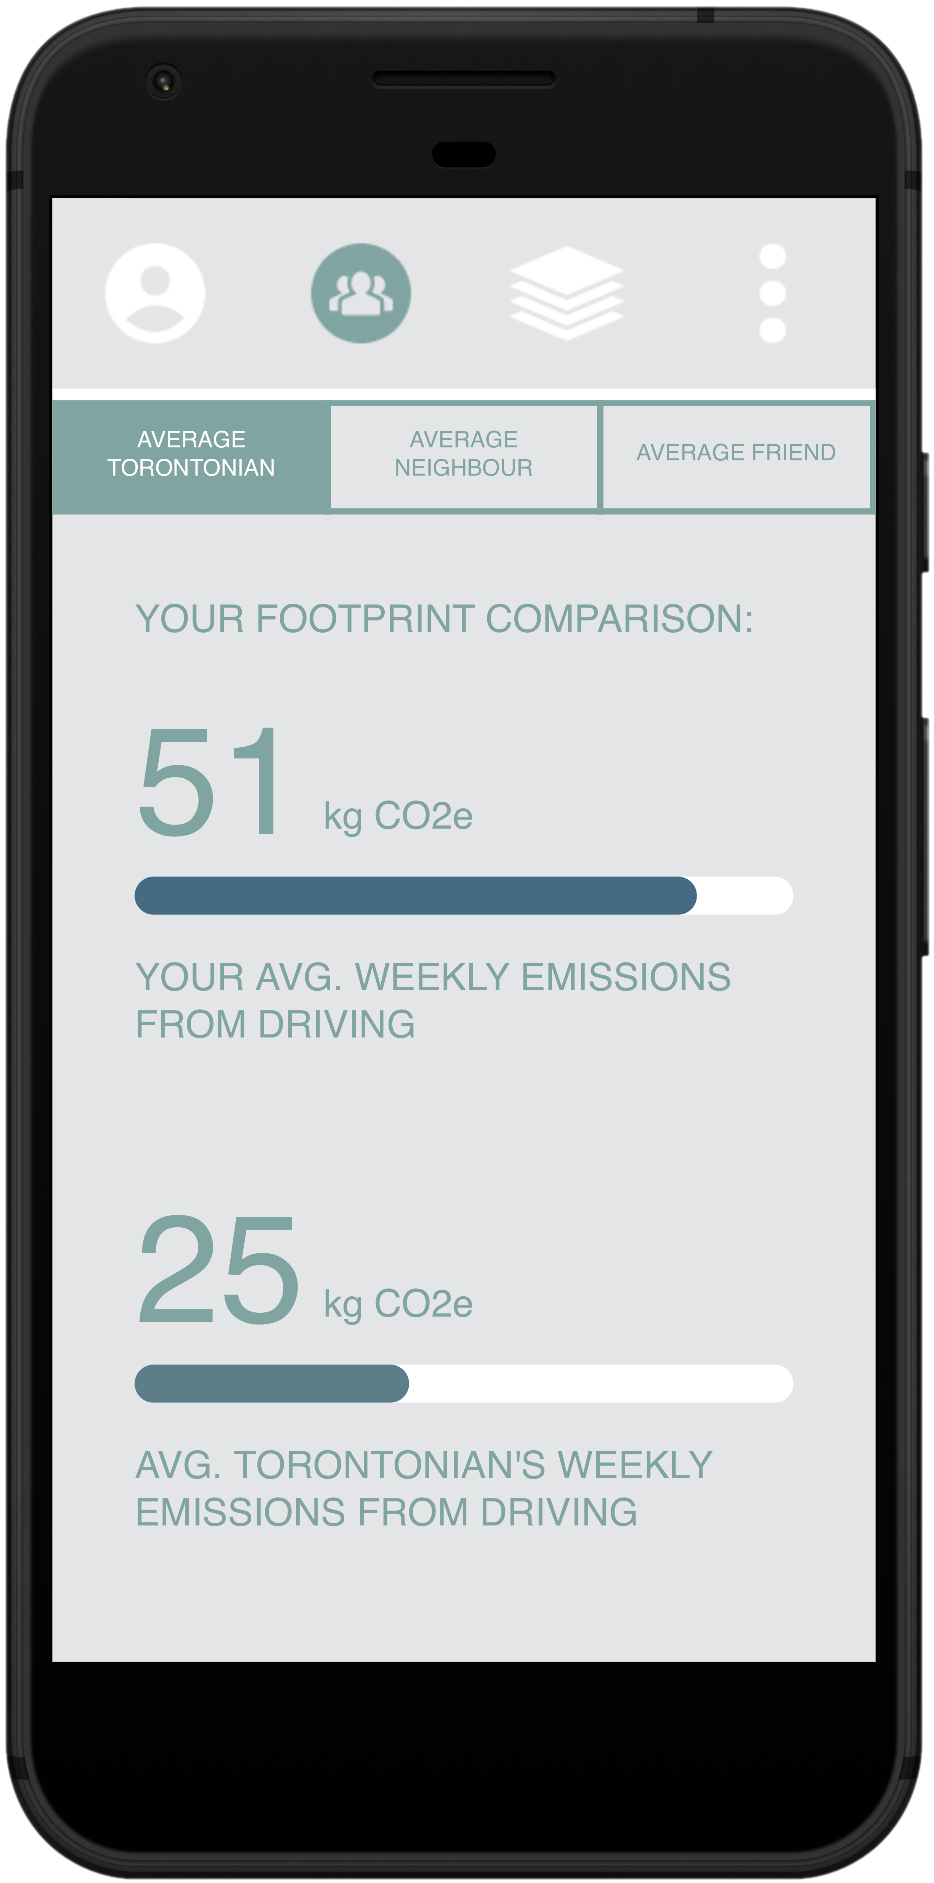
The first prototype concentrated on giving the user their footprint with a number value. All options to lower their footprint was also compared through numbers.


Prototype Two
The second prototype concentrated on giving the user their footprint with a number value in addition to a volume-based visualization. All options to lower their footprint was also compared through volume.


Prototype Three
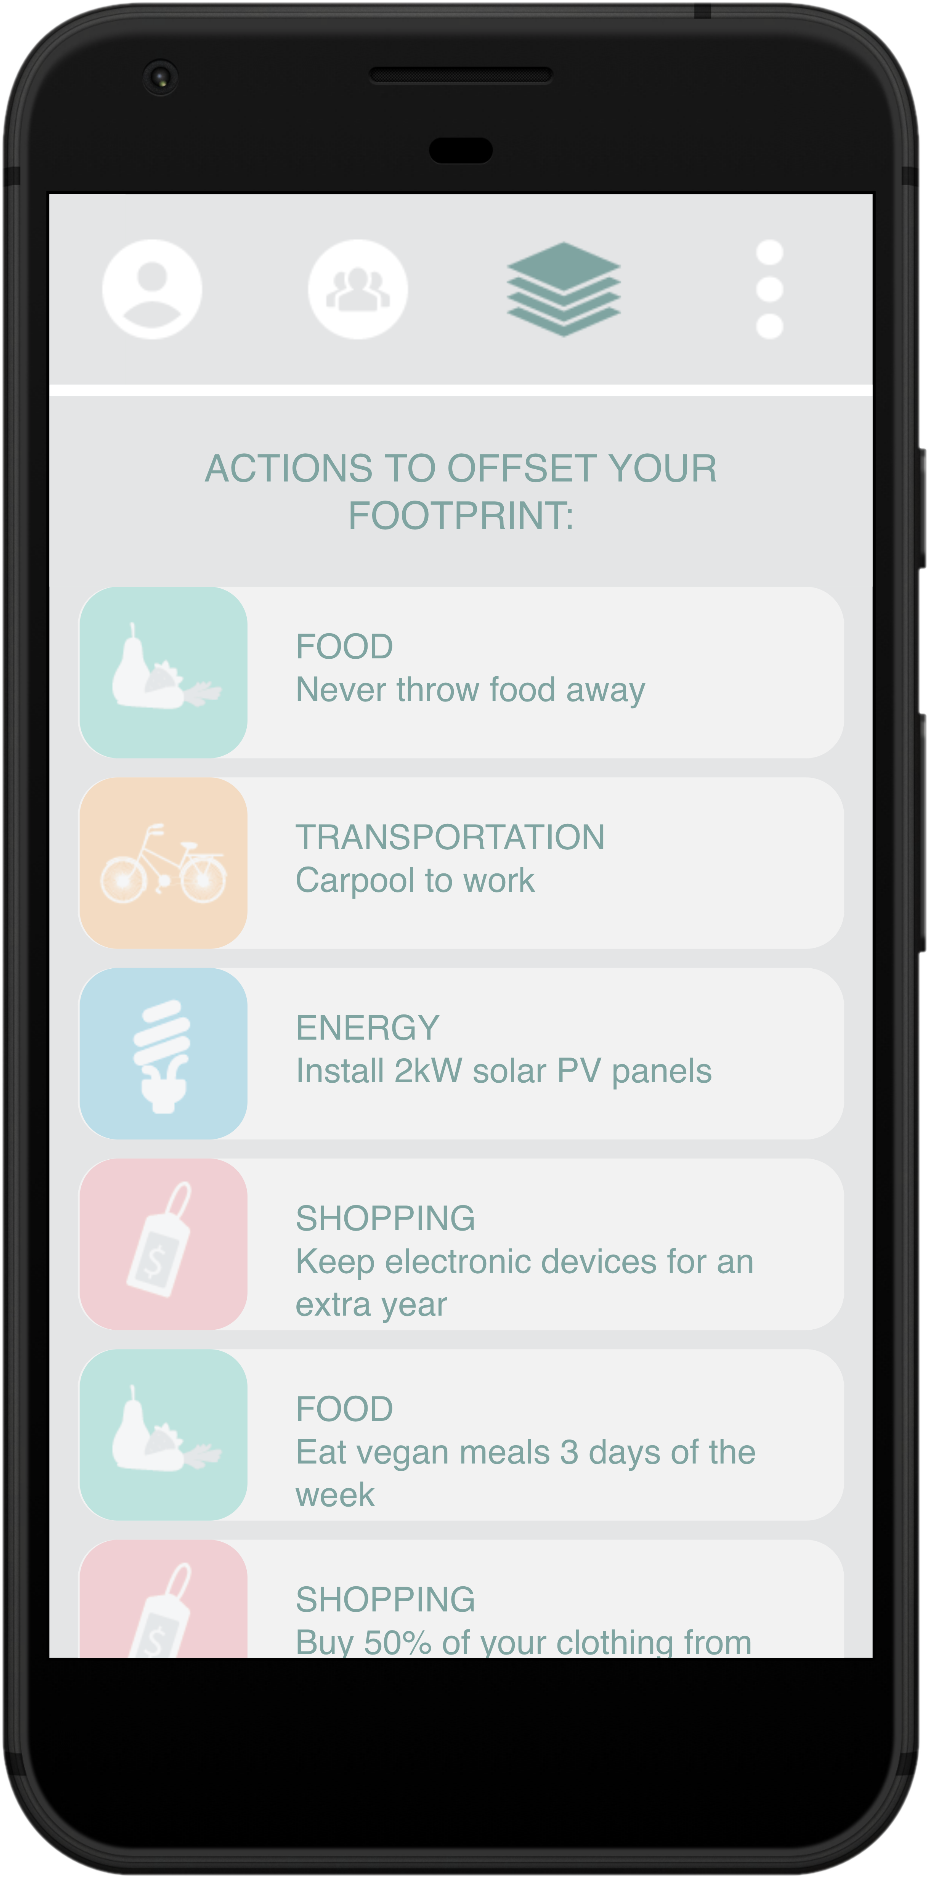
The third prototype concentrated on emphasizing alternate options for purchasing grocery items to the user. All options to lower their footprint was also compared through numbers in carbon volume and money values.


05 | USER TESTING
The prototypes were tested with 3 random users in the same North York neighbourhood. Through testing the prototypes, the most engaging methods of educating the user about their carbon footprint was by comparing their own values with friends or city-averages and offering options on how to lower their current footprint.
06 | FUTURE ITERATIONS
As a result of the testing and first few rounds of interface design, it is clear that there are still gaps in public knowledge on the carbon emissions attached to everything we consume on a daily basis. What needs to be concentrated on is building a community network that encourages members to lower their footprint, and a repository of alternative options that users can readily refer to and utilize.
While many solutions to leading a sustainable lifestyle depend on governmental action and development of new technologies, there are also many existing options and adjustments that can lower our emissions. These existing options only need to be made aware to users.